French vs Immigrants from Taiwan Seniors Poverty Over the Age of 75
COMPARE
French
Immigrants from Taiwan
Seniors Poverty Over the Age of 75
Seniors Poverty Over the Age of 75 Comparison
French
Immigrants from Taiwan
11.1%
SENIORS POVERTY OVER THE AGE OF 75
98.7/ 100
METRIC RATING
48th/ 347
METRIC RANK
11.4%
SENIORS POVERTY OVER THE AGE OF 75
96.7/ 100
METRIC RATING
65th/ 347
METRIC RANK
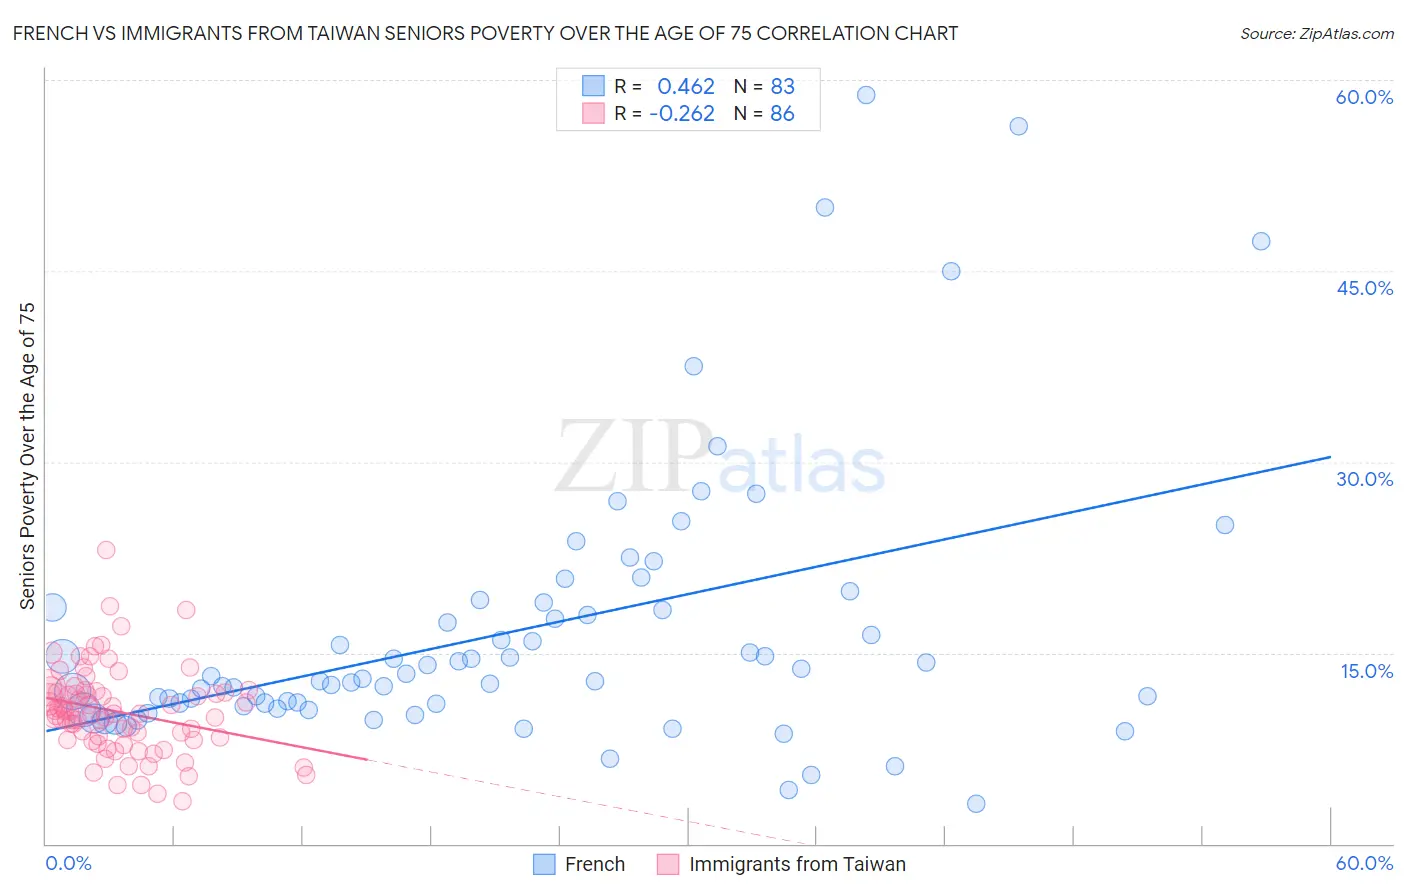
French vs Immigrants from Taiwan Seniors Poverty Over the Age of 75 Correlation Chart
The statistical analysis conducted on geographies consisting of 555,221,487 people shows a moderate positive correlation between the proportion of French and poverty level among seniors over the age of 75 in the United States with a correlation coefficient (R) of 0.462 and weighted average of 11.1%. Similarly, the statistical analysis conducted on geographies consisting of 295,351,914 people shows a weak negative correlation between the proportion of Immigrants from Taiwan and poverty level among seniors over the age of 75 in the United States with a correlation coefficient (R) of -0.262 and weighted average of 11.4%, a difference of 2.2%.
Seniors Poverty Over the Age of 75 Correlation Summary
| Measurement | French | Immigrants from Taiwan |
| Minimum | 3.1% | 3.3% |
| Maximum | 58.9% | 23.1% |
| Range | 55.7% | 19.8% |
| Mean | 16.7% | 10.4% |
| Median | 13.0% | 10.2% |
| Interquartile 25% (IQ1) | 10.8% | 8.2% |
| Interquartile 75% (IQ3) | 18.6% | 11.9% |
| Interquartile Range (IQR) | 7.8% | 3.7% |
| Standard Deviation (Sample) | 10.8% | 3.4% |
| Standard Deviation (Population) | 10.7% | 3.4% |
Demographics Similar to French and Immigrants from Taiwan by Seniors Poverty Over the Age of 75
In terms of seniors poverty over the age of 75, the demographic groups most similar to French are Hawaiian (11.1%, a difference of 0.040%), Samoan (11.1%, a difference of 0.11%), Serbian (11.1%, a difference of 0.22%), Immigrants from North Macedonia (11.1%, a difference of 0.25%), and Zimbabwean (11.2%, a difference of 0.40%). Similarly, the demographic groups most similar to Immigrants from Taiwan are Estonian (11.4%, a difference of 0.020%), Immigrants from Northern Europe (11.3%, a difference of 0.51%), Immigrants from Afghanistan (11.3%, a difference of 0.65%), Immigrants from North America (11.3%, a difference of 0.68%), and Canadian (11.3%, a difference of 0.78%).
| Demographics | Rating | Rank | Seniors Poverty Over the Age of 75 |
| Greeks | 99.0 /100 | #46 | Exceptional 11.1% |
| Hawaiians | 98.8 /100 | #47 | Exceptional 11.1% |
| French | 98.7 /100 | #48 | Exceptional 11.1% |
| Samoans | 98.7 /100 | #49 | Exceptional 11.1% |
| Serbians | 98.6 /100 | #50 | Exceptional 11.1% |
| Immigrants | North Macedonia | 98.6 /100 | #51 | Exceptional 11.1% |
| Zimbabweans | 98.5 /100 | #52 | Exceptional 11.2% |
| Immigrants | England | 98.4 /100 | #53 | Exceptional 11.2% |
| Afghans | 98.2 /100 | #54 | Exceptional 11.2% |
| Hungarians | 98.1 /100 | #55 | Exceptional 11.2% |
| Slavs | 98.1 /100 | #56 | Exceptional 11.2% |
| Immigrants | Canada | 97.9 /100 | #57 | Exceptional 11.2% |
| Yugoslavians | 97.9 /100 | #58 | Exceptional 11.2% |
| Immigrants | Netherlands | 97.8 /100 | #59 | Exceptional 11.2% |
| Eastern Europeans | 97.7 /100 | #60 | Exceptional 11.3% |
| Canadians | 97.7 /100 | #61 | Exceptional 11.3% |
| Immigrants | North America | 97.6 /100 | #62 | Exceptional 11.3% |
| Immigrants | Afghanistan | 97.5 /100 | #63 | Exceptional 11.3% |
| Immigrants | Northern Europe | 97.4 /100 | #64 | Exceptional 11.3% |
| Immigrants | Taiwan | 96.7 /100 | #65 | Exceptional 11.4% |
| Estonians | 96.7 /100 | #66 | Exceptional 11.4% |