Immigrants from South Africa vs Immigrants from Taiwan Seniors Poverty Over the Age of 75
COMPARE
Immigrants from South Africa
Immigrants from Taiwan
Seniors Poverty Over the Age of 75
Seniors Poverty Over the Age of 75 Comparison
Immigrants from South Africa
Immigrants from Taiwan
11.5%
SENIORS POVERTY OVER THE AGE OF 75
94.9/ 100
METRIC RATING
83rd/ 347
METRIC RANK
11.4%
SENIORS POVERTY OVER THE AGE OF 75
96.7/ 100
METRIC RATING
65th/ 347
METRIC RANK
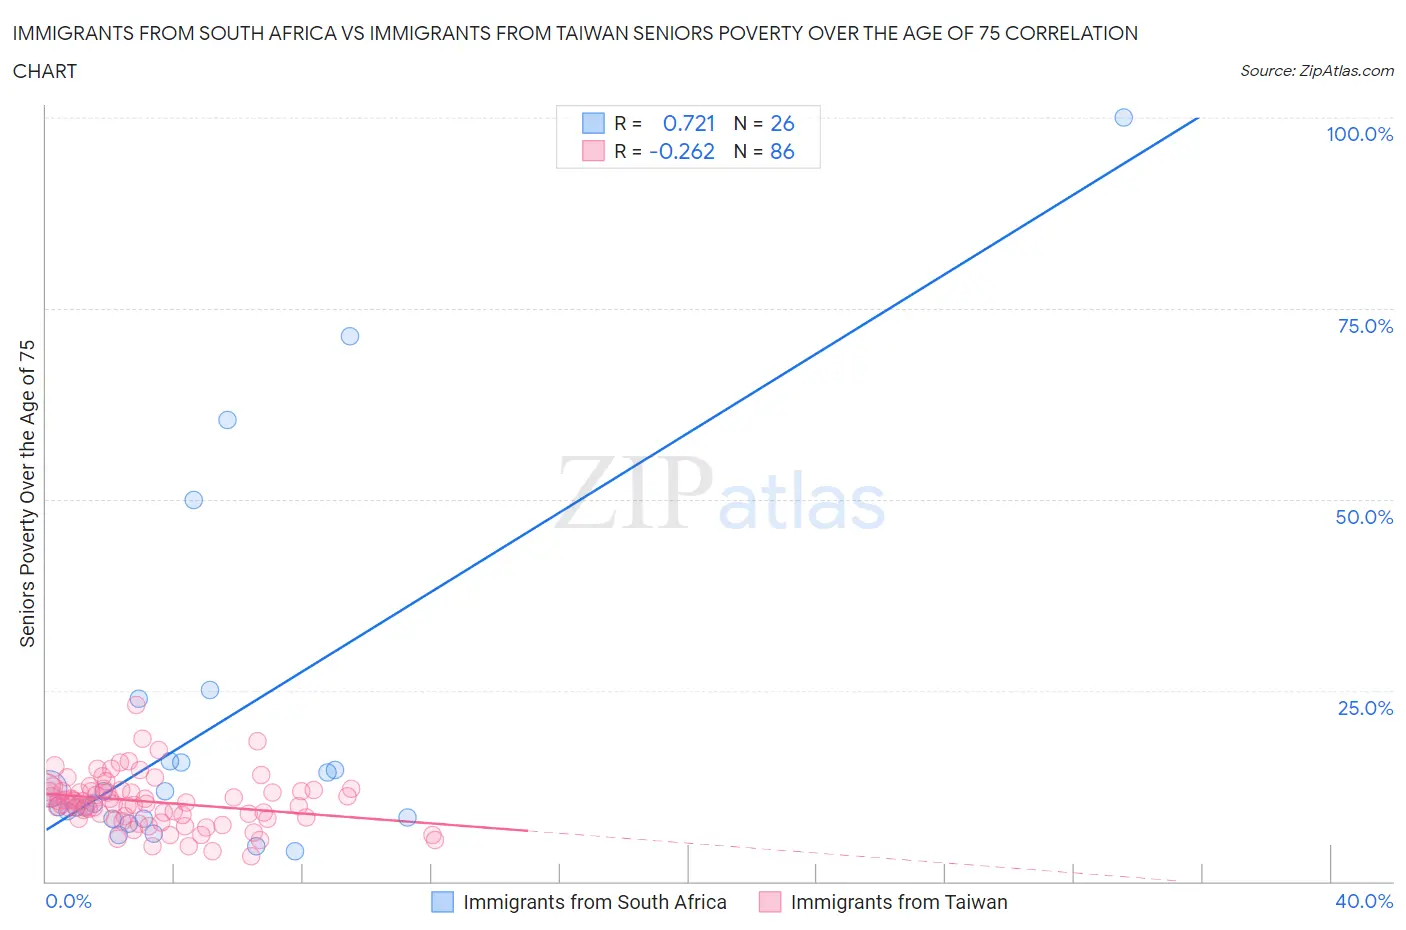
Immigrants from South Africa vs Immigrants from Taiwan Seniors Poverty Over the Age of 75 Correlation Chart
The statistical analysis conducted on geographies consisting of 231,486,555 people shows a strong positive correlation between the proportion of Immigrants from South Africa and poverty level among seniors over the age of 75 in the United States with a correlation coefficient (R) of 0.721 and weighted average of 11.5%. Similarly, the statistical analysis conducted on geographies consisting of 295,351,914 people shows a weak negative correlation between the proportion of Immigrants from Taiwan and poverty level among seniors over the age of 75 in the United States with a correlation coefficient (R) of -0.262 and weighted average of 11.4%, a difference of 0.99%.
Seniors Poverty Over the Age of 75 Correlation Summary
| Measurement | Immigrants from South Africa | Immigrants from Taiwan |
| Minimum | 4.0% | 3.3% |
| Maximum | 100.0% | 23.1% |
| Range | 96.0% | 19.8% |
| Mean | 20.3% | 10.4% |
| Median | 11.0% | 10.2% |
| Interquartile 25% (IQ1) | 8.3% | 8.2% |
| Interquartile 75% (IQ3) | 15.7% | 11.9% |
| Interquartile Range (IQR) | 7.5% | 3.7% |
| Standard Deviation (Sample) | 23.6% | 3.4% |
| Standard Deviation (Population) | 23.1% | 3.4% |
Demographics Similar to Immigrants from South Africa and Immigrants from Taiwan by Seniors Poverty Over the Age of 75
In terms of seniors poverty over the age of 75, the demographic groups most similar to Immigrants from South Africa are Immigrants from Iraq (11.5%, a difference of 0.0%), Iranian (11.5%, a difference of 0.080%), Basque (11.5%, a difference of 0.10%), Alaska Native (11.4%, a difference of 0.22%), and Filipino (11.4%, a difference of 0.27%). Similarly, the demographic groups most similar to Immigrants from Taiwan are Estonian (11.4%, a difference of 0.020%), Bolivian (11.4%, a difference of 0.12%), Immigrants from Austria (11.4%, a difference of 0.14%), Ottawa (11.4%, a difference of 0.15%), and Immigrants from South Central Asia (11.4%, a difference of 0.18%).
| Demographics | Rating | Rank | Seniors Poverty Over the Age of 75 |
| Immigrants | Northern Europe | 97.4 /100 | #64 | Exceptional 11.3% |
| Immigrants | Taiwan | 96.7 /100 | #65 | Exceptional 11.4% |
| Estonians | 96.7 /100 | #66 | Exceptional 11.4% |
| Bolivians | 96.5 /100 | #67 | Exceptional 11.4% |
| Immigrants | Austria | 96.5 /100 | #68 | Exceptional 11.4% |
| Ottawa | 96.5 /100 | #69 | Exceptional 11.4% |
| Immigrants | South Central Asia | 96.4 /100 | #70 | Exceptional 11.4% |
| Osage | 96.3 /100 | #71 | Exceptional 11.4% |
| Sierra Leoneans | 96.1 /100 | #72 | Exceptional 11.4% |
| Immigrants | Micronesia | 96.0 /100 | #73 | Exceptional 11.4% |
| Delaware | 96.0 /100 | #74 | Exceptional 11.4% |
| Palestinians | 95.8 /100 | #75 | Exceptional 11.4% |
| French Canadians | 95.7 /100 | #76 | Exceptional 11.4% |
| Whites/Caucasians | 95.5 /100 | #77 | Exceptional 11.4% |
| Macedonians | 95.5 /100 | #78 | Exceptional 11.4% |
| Filipinos | 95.5 /100 | #79 | Exceptional 11.4% |
| Alaska Natives | 95.4 /100 | #80 | Exceptional 11.4% |
| Basques | 95.1 /100 | #81 | Exceptional 11.5% |
| Iranians | 95.1 /100 | #82 | Exceptional 11.5% |
| Immigrants | South Africa | 94.9 /100 | #83 | Exceptional 11.5% |
| Immigrants | Iraq | 94.9 /100 | #84 | Exceptional 11.5% |