French Canadian vs Immigrants from Hungary Child Poverty Under the Age of 5
COMPARE
French Canadian
Immigrants from Hungary
Child Poverty Under the Age of 5
Child Poverty Under the Age of 5 Comparison
French Canadians
Immigrants from Hungary
17.7%
CHILD POVERTY UNDER THE AGE OF 5
24.6/ 100
METRIC RATING
194th/ 347
METRIC RANK
16.5%
CHILD POVERTY UNDER THE AGE OF 5
84.5/ 100
METRIC RATING
139th/ 347
METRIC RANK
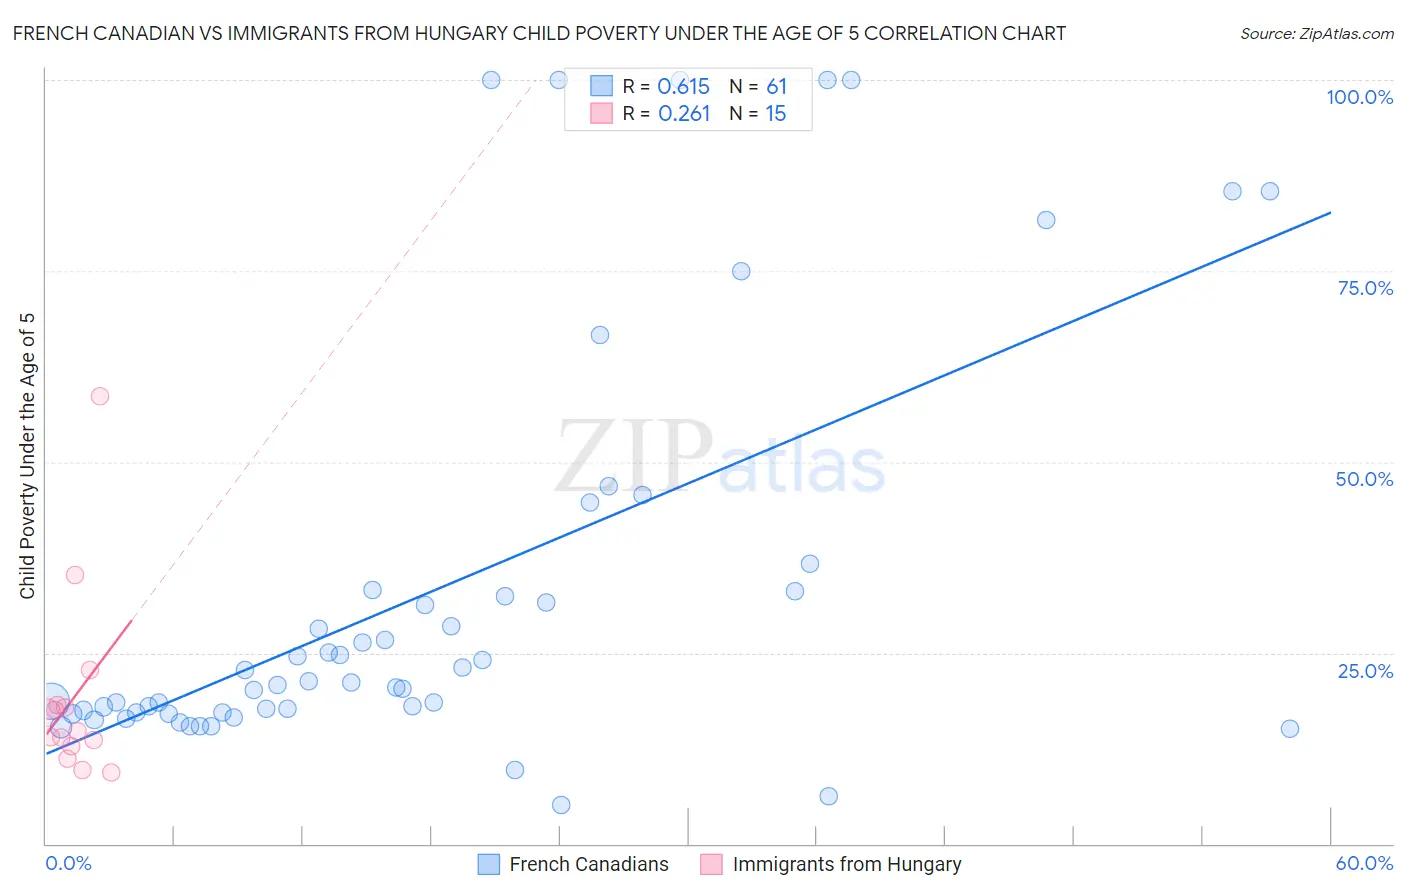
French Canadian vs Immigrants from Hungary Child Poverty Under the Age of 5 Correlation Chart
The statistical analysis conducted on geographies consisting of 472,749,026 people shows a significant positive correlation between the proportion of French Canadians and poverty level among children under the age of 5 in the United States with a correlation coefficient (R) of 0.615 and weighted average of 17.7%. Similarly, the statistical analysis conducted on geographies consisting of 189,885,698 people shows a weak positive correlation between the proportion of Immigrants from Hungary and poverty level among children under the age of 5 in the United States with a correlation coefficient (R) of 0.261 and weighted average of 16.5%, a difference of 7.6%.
Child Poverty Under the Age of 5 Correlation Summary
| Measurement | French Canadian | Immigrants from Hungary |
| Minimum | 5.1% | 9.4% |
| Maximum | 100.0% | 58.6% |
| Range | 94.9% | 49.2% |
| Mean | 33.1% | 19.1% |
| Median | 21.2% | 14.7% |
| Interquartile 25% (IQ1) | 17.2% | 12.8% |
| Interquartile 75% (IQ3) | 33.2% | 18.2% |
| Interquartile Range (IQR) | 16.0% | 5.4% |
| Standard Deviation (Sample) | 26.8% | 12.6% |
| Standard Deviation (Population) | 26.6% | 12.2% |
Similar Demographics by Child Poverty Under the Age of 5
Demographics Similar to French Canadians by Child Poverty Under the Age of 5
In terms of child poverty under the age of 5, the demographic groups most similar to French Canadians are Immigrants from Uganda (17.7%, a difference of 0.060%), Sierra Leonean (17.7%, a difference of 0.070%), Immigrants from Portugal (17.8%, a difference of 0.34%), Immigrants from Afghanistan (17.7%, a difference of 0.43%), and Immigrants from Uruguay (17.7%, a difference of 0.43%).
| Demographics | Rating | Rank | Child Poverty Under the Age of 5 |
| Kenyans | 34.7 /100 | #187 | Fair 17.5% |
| Carpatho Rusyns | 33.6 /100 | #188 | Fair 17.5% |
| French | 33.6 /100 | #189 | Fair 17.5% |
| Slovaks | 29.2 /100 | #190 | Fair 17.6% |
| Immigrants | Afghanistan | 27.9 /100 | #191 | Fair 17.7% |
| Immigrants | Uruguay | 27.8 /100 | #192 | Fair 17.7% |
| Immigrants | Uganda | 25.0 /100 | #193 | Fair 17.7% |
| French Canadians | 24.6 /100 | #194 | Fair 17.7% |
| Sierra Leoneans | 24.1 /100 | #195 | Fair 17.7% |
| Immigrants | Portugal | 22.2 /100 | #196 | Fair 17.8% |
| Immigrants | Kenya | 20.0 /100 | #197 | Fair 17.9% |
| Celtics | 18.3 /100 | #198 | Poor 17.9% |
| Hungarians | 18.3 /100 | #199 | Poor 17.9% |
| Iraqis | 14.0 /100 | #200 | Poor 18.0% |
| Ugandans | 13.9 /100 | #201 | Poor 18.0% |
Demographics Similar to Immigrants from Hungary by Child Poverty Under the Age of 5
In terms of child poverty under the age of 5, the demographic groups most similar to Immigrants from Hungary are German (16.5%, a difference of 0.060%), Guamanian/Chamorro (16.5%, a difference of 0.070%), Immigrants from Chile (16.4%, a difference of 0.16%), Immigrants from Western Europe (16.5%, a difference of 0.25%), and Portuguese (16.5%, a difference of 0.30%).
| Demographics | Rating | Rank | Child Poverty Under the Age of 5 |
| Serbians | 88.2 /100 | #132 | Excellent 16.3% |
| Icelanders | 87.9 /100 | #133 | Excellent 16.3% |
| Immigrants | North Macedonia | 87.8 /100 | #134 | Excellent 16.4% |
| Brazilians | 87.8 /100 | #135 | Excellent 16.4% |
| Immigrants | Northern Africa | 87.5 /100 | #136 | Excellent 16.4% |
| Immigrants | Chile | 85.3 /100 | #137 | Excellent 16.4% |
| Germans | 84.8 /100 | #138 | Excellent 16.5% |
| Immigrants | Hungary | 84.5 /100 | #139 | Excellent 16.5% |
| Guamanians/Chamorros | 84.2 /100 | #140 | Excellent 16.5% |
| Immigrants | Western Europe | 83.3 /100 | #141 | Excellent 16.5% |
| Portuguese | 83.0 /100 | #142 | Excellent 16.5% |
| Samoans | 83.0 /100 | #143 | Excellent 16.5% |
| Ethiopians | 82.7 /100 | #144 | Excellent 16.5% |
| Immigrants | Ethiopia | 82.1 /100 | #145 | Excellent 16.6% |
| Israelis | 82.0 /100 | #146 | Excellent 16.6% |