Estonian vs German Receiving Food Stamps
COMPARE
Estonian
German
Receiving Food Stamps
Receiving Food Stamps Comparison
Estonians
Germans
9.5%
RECEIVING FOOD STAMPS
99.6/ 100
METRIC RATING
36th/ 347
METRIC RANK
9.7%
RECEIVING FOOD STAMPS
99.2/ 100
METRIC RATING
60th/ 347
METRIC RANK
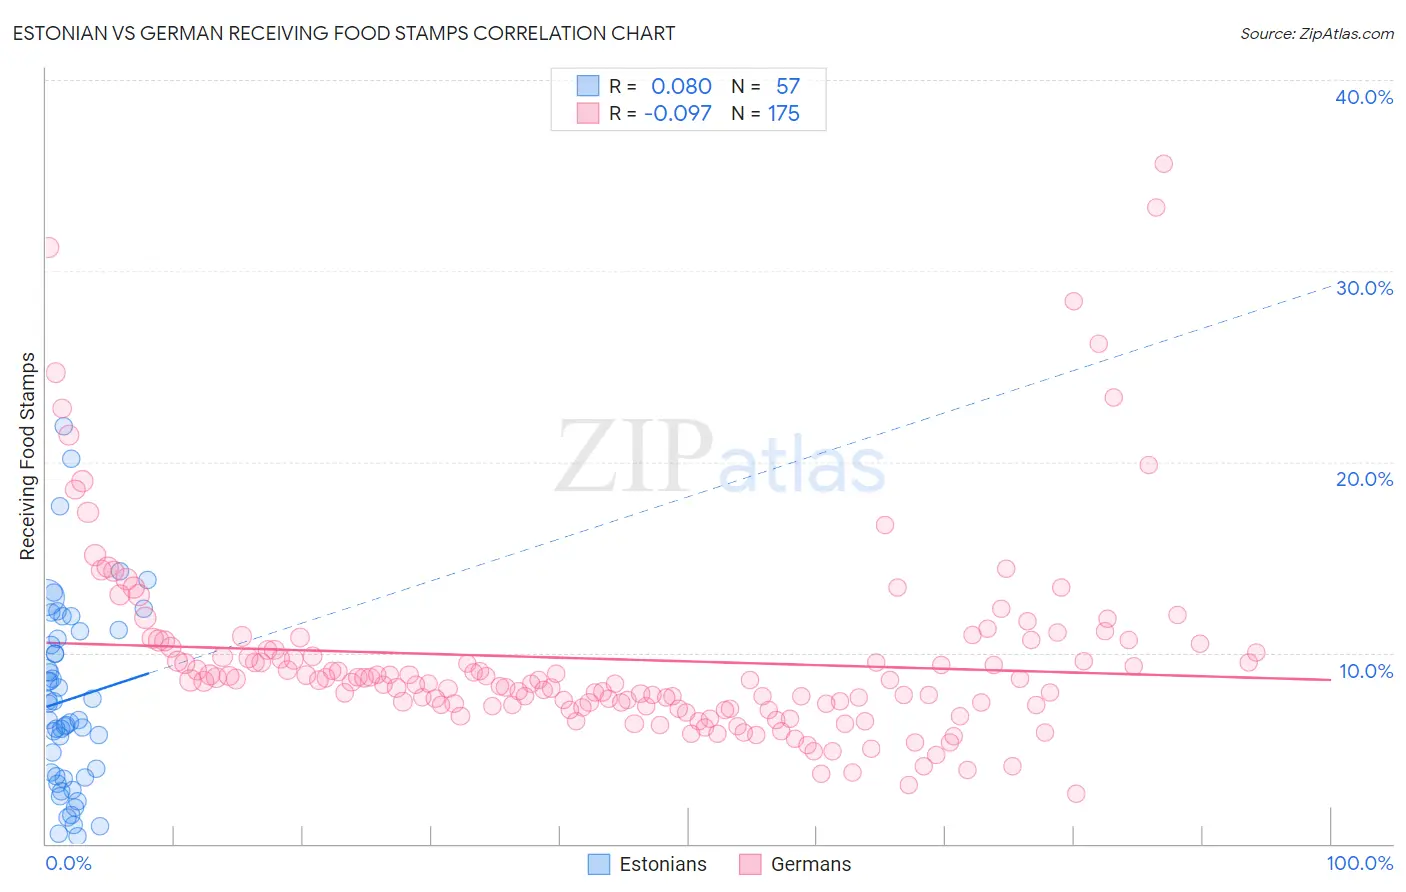
Estonian vs German Receiving Food Stamps Correlation Chart
The statistical analysis conducted on geographies consisting of 123,351,166 people shows a slight positive correlation between the proportion of Estonians and percentage of population receiving government assistance and/or food stamps in the United States with a correlation coefficient (R) of 0.080 and weighted average of 9.5%. Similarly, the statistical analysis conducted on geographies consisting of 576,781,098 people shows a slight negative correlation between the proportion of Germans and percentage of population receiving government assistance and/or food stamps in the United States with a correlation coefficient (R) of -0.097 and weighted average of 9.7%, a difference of 2.7%.
Receiving Food Stamps Correlation Summary
| Measurement | Estonian | German |
| Minimum | 0.40% | 2.6% |
| Maximum | 21.8% | 35.6% |
| Range | 21.4% | 33.0% |
| Mean | 7.6% | 9.7% |
| Median | 6.5% | 8.6% |
| Interquartile 25% (IQ1) | 3.5% | 7.2% |
| Interquartile 75% (IQ3) | 10.9% | 10.1% |
| Interquartile Range (IQR) | 7.4% | 2.9% |
| Standard Deviation (Sample) | 4.8% | 5.1% |
| Standard Deviation (Population) | 4.8% | 5.1% |
Similar Demographics by Receiving Food Stamps
Demographics Similar to Estonians by Receiving Food Stamps
In terms of receiving food stamps, the demographic groups most similar to Estonians are Immigrants from Austria (9.5%, a difference of 0.020%), Turkish (9.5%, a difference of 0.050%), Zimbabwean (9.5%, a difference of 0.070%), European (9.5%, a difference of 0.070%), and Immigrants from Sri Lanka (9.5%, a difference of 0.36%).
| Demographics | Rating | Rank | Receiving Food Stamps |
| Immigrants | Lithuania | 99.8 /100 | #29 | Exceptional 9.2% |
| Immigrants | Sweden | 99.7 /100 | #30 | Exceptional 9.3% |
| Immigrants | Eastern Asia | 99.7 /100 | #31 | Exceptional 9.3% |
| Bolivians | 99.7 /100 | #32 | Exceptional 9.3% |
| Zimbabweans | 99.6 /100 | #33 | Exceptional 9.5% |
| Turks | 99.6 /100 | #34 | Exceptional 9.5% |
| Immigrants | Austria | 99.6 /100 | #35 | Exceptional 9.5% |
| Estonians | 99.6 /100 | #36 | Exceptional 9.5% |
| Europeans | 99.6 /100 | #37 | Exceptional 9.5% |
| Immigrants | Sri Lanka | 99.5 /100 | #38 | Exceptional 9.5% |
| Immigrants | Bolivia | 99.5 /100 | #39 | Exceptional 9.5% |
| Immigrants | Netherlands | 99.5 /100 | #40 | Exceptional 9.5% |
| Cambodians | 99.5 /100 | #41 | Exceptional 9.5% |
| Immigrants | China | 99.5 /100 | #42 | Exceptional 9.6% |
| Croatians | 99.5 /100 | #43 | Exceptional 9.6% |
Demographics Similar to Germans by Receiving Food Stamps
In terms of receiving food stamps, the demographic groups most similar to Germans are British (9.7%, a difference of 0.10%), Scandinavian (9.7%, a difference of 0.13%), English (9.8%, a difference of 0.14%), Greek (9.7%, a difference of 0.19%), and Immigrants from Bulgaria (9.8%, a difference of 0.22%).
| Demographics | Rating | Rank | Receiving Food Stamps |
| Tongans | 99.3 /100 | #53 | Exceptional 9.7% |
| Swiss | 99.3 /100 | #54 | Exceptional 9.7% |
| Immigrants | Switzerland | 99.3 /100 | #55 | Exceptional 9.7% |
| Immigrants | Canada | 99.3 /100 | #56 | Exceptional 9.7% |
| Greeks | 99.3 /100 | #57 | Exceptional 9.7% |
| Scandinavians | 99.2 /100 | #58 | Exceptional 9.7% |
| British | 99.2 /100 | #59 | Exceptional 9.7% |
| Germans | 99.2 /100 | #60 | Exceptional 9.7% |
| English | 99.2 /100 | #61 | Exceptional 9.8% |
| Immigrants | Bulgaria | 99.2 /100 | #62 | Exceptional 9.8% |
| Chinese | 99.2 /100 | #63 | Exceptional 9.8% |
| Immigrants | North America | 99.2 /100 | #64 | Exceptional 9.8% |
| Immigrants | Turkey | 99.1 /100 | #65 | Exceptional 9.8% |
| Slovenes | 99.1 /100 | #66 | Exceptional 9.8% |
| Immigrants | Indonesia | 99.0 /100 | #67 | Exceptional 9.8% |