Egyptian vs Vietnamese 2nd Grade
COMPARE
Egyptian
Vietnamese
2nd Grade
2nd Grade Comparison
Egyptians
Vietnamese
97.9%
2ND GRADE
44.3/ 100
METRIC RATING
181st/ 347
METRIC RANK
96.7%
2ND GRADE
0.0/ 100
METRIC RATING
323rd/ 347
METRIC RANK
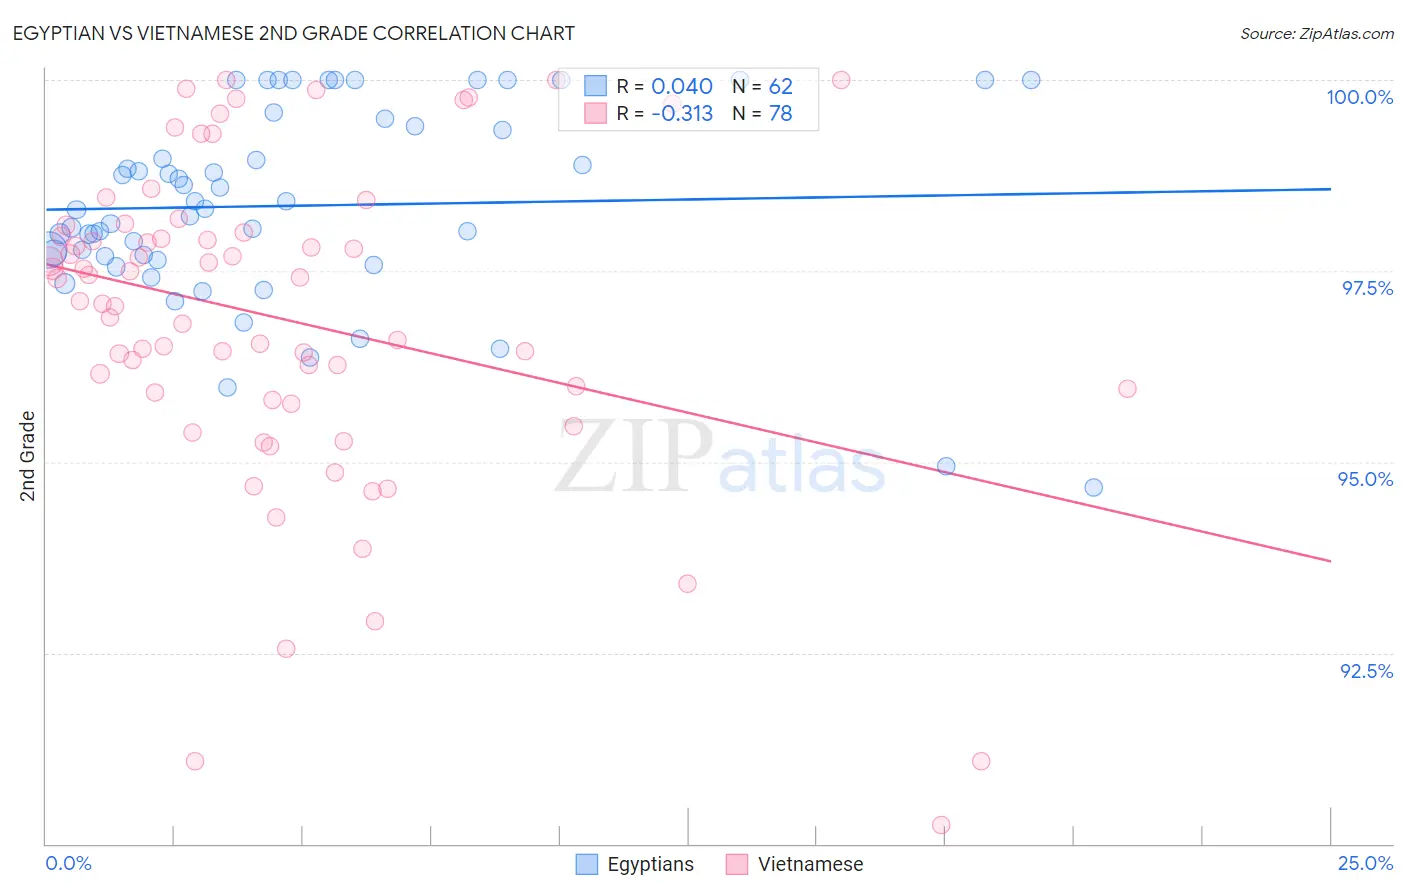
Egyptian vs Vietnamese 2nd Grade Correlation Chart
The statistical analysis conducted on geographies consisting of 276,927,423 people shows no correlation between the proportion of Egyptians and percentage of population with at least 2nd grade education in the United States with a correlation coefficient (R) of 0.040 and weighted average of 97.9%. Similarly, the statistical analysis conducted on geographies consisting of 170,753,564 people shows a mild negative correlation between the proportion of Vietnamese and percentage of population with at least 2nd grade education in the United States with a correlation coefficient (R) of -0.313 and weighted average of 96.7%, a difference of 1.2%.
2nd Grade Correlation Summary
| Measurement | Egyptian | Vietnamese |
| Minimum | 94.7% | 90.2% |
| Maximum | 100.0% | 100.0% |
| Range | 5.3% | 9.8% |
| Mean | 98.4% | 96.9% |
| Median | 98.3% | 97.3% |
| Interquartile 25% (IQ1) | 97.7% | 95.9% |
| Interquartile 75% (IQ3) | 99.4% | 98.0% |
| Interquartile Range (IQR) | 1.7% | 2.1% |
| Standard Deviation (Sample) | 1.3% | 2.1% |
| Standard Deviation (Population) | 1.3% | 2.1% |
Similar Demographics by 2nd Grade
Demographics Similar to Egyptians by 2nd Grade
In terms of 2nd grade, the demographic groups most similar to Egyptians are Native/Alaskan (97.9%, a difference of 0.0%), Immigrants from Sri Lanka (97.9%, a difference of 0.010%), Immigrants from Brazil (97.9%, a difference of 0.010%), Argentinean (97.9%, a difference of 0.010%), and Immigrants from Venezuela (97.9%, a difference of 0.010%).
| Demographics | Rating | Rank | 2nd Grade |
| Immigrants | Micronesia | 50.0 /100 | #174 | Average 97.9% |
| Immigrants | Bosnia and Herzegovina | 49.8 /100 | #175 | Average 97.9% |
| Immigrants | Sri Lanka | 48.7 /100 | #176 | Average 97.9% |
| Immigrants | Brazil | 46.6 /100 | #177 | Average 97.9% |
| Argentineans | 46.3 /100 | #178 | Average 97.9% |
| Immigrants | Venezuela | 46.1 /100 | #179 | Average 97.9% |
| Natives/Alaskans | 44.3 /100 | #180 | Average 97.9% |
| Egyptians | 44.3 /100 | #181 | Average 97.9% |
| Portuguese | 42.4 /100 | #182 | Average 97.8% |
| Immigrants | Poland | 42.2 /100 | #183 | Average 97.8% |
| Immigrants | Belarus | 41.5 /100 | #184 | Average 97.8% |
| Immigrants | Argentina | 40.6 /100 | #185 | Average 97.8% |
| Arabs | 36.9 /100 | #186 | Fair 97.8% |
| Pakistanis | 36.1 /100 | #187 | Fair 97.8% |
| Immigrants | Kazakhstan | 35.6 /100 | #188 | Fair 97.8% |
Demographics Similar to Vietnamese by 2nd Grade
In terms of 2nd grade, the demographic groups most similar to Vietnamese are Mexican American Indian (96.7%, a difference of 0.020%), Immigrants from Bangladesh (96.7%, a difference of 0.030%), Immigrants from Nicaragua (96.7%, a difference of 0.060%), Immigrants from Guyana (96.7%, a difference of 0.060%), and Immigrants from Burma/Myanmar (96.7%, a difference of 0.060%).
| Demographics | Rating | Rank | 2nd Grade |
| Hondurans | 0.0 /100 | #316 | Tragic 96.7% |
| Immigrants | Laos | 0.0 /100 | #317 | Tragic 96.7% |
| Indonesians | 0.0 /100 | #318 | Tragic 96.7% |
| Immigrants | Nicaragua | 0.0 /100 | #319 | Tragic 96.7% |
| Immigrants | Guyana | 0.0 /100 | #320 | Tragic 96.7% |
| Immigrants | Burma/Myanmar | 0.0 /100 | #321 | Tragic 96.7% |
| Immigrants | Bangladesh | 0.0 /100 | #322 | Tragic 96.7% |
| Vietnamese | 0.0 /100 | #323 | Tragic 96.7% |
| Mexican American Indians | 0.0 /100 | #324 | Tragic 96.7% |
| Dominicans | 0.0 /100 | #325 | Tragic 96.6% |
| Immigrants | Honduras | 0.0 /100 | #326 | Tragic 96.6% |
| Immigrants | Vietnam | 0.0 /100 | #327 | Tragic 96.5% |
| Mexicans | 0.0 /100 | #328 | Tragic 96.5% |
| Japanese | 0.0 /100 | #329 | Tragic 96.5% |
| Immigrants | Latin America | 0.0 /100 | #330 | Tragic 96.5% |