Ecuadorian vs Alsatian Single Father Poverty
COMPARE
Ecuadorian
Alsatian
Single Father Poverty
Single Father Poverty Comparison
Ecuadorians
Alsatians
16.5%
SINGLE FATHER POVERTY
24.5/ 100
METRIC RATING
193rd/ 347
METRIC RANK
17.8%
SINGLE FATHER POVERTY
0.0/ 100
METRIC RATING
283rd/ 347
METRIC RANK
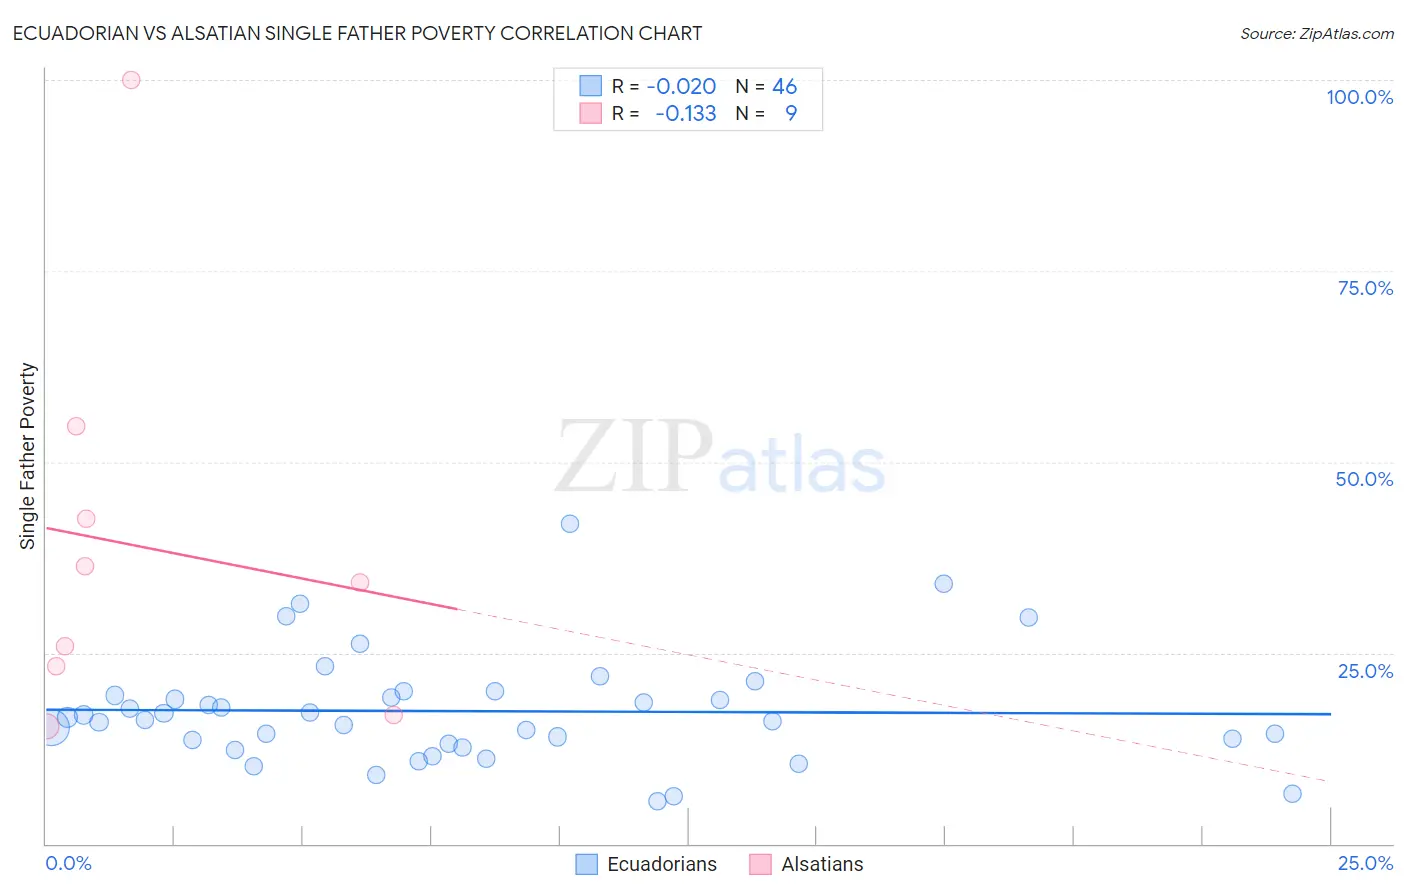
Ecuadorian vs Alsatian Single Father Poverty Correlation Chart
The statistical analysis conducted on geographies consisting of 258,169,372 people shows no correlation between the proportion of Ecuadorians and poverty level among single fathers in the United States with a correlation coefficient (R) of -0.020 and weighted average of 16.5%. Similarly, the statistical analysis conducted on geographies consisting of 73,758,627 people shows a poor negative correlation between the proportion of Alsatians and poverty level among single fathers in the United States with a correlation coefficient (R) of -0.133 and weighted average of 17.8%, a difference of 8.0%.
Single Father Poverty Correlation Summary
| Measurement | Ecuadorian | Alsatian |
| Minimum | 5.6% | 15.4% |
| Maximum | 41.9% | 100.0% |
| Range | 36.3% | 84.6% |
| Mean | 17.4% | 38.8% |
| Median | 16.4% | 34.2% |
| Interquartile 25% (IQ1) | 13.2% | 20.1% |
| Interquartile 75% (IQ3) | 19.4% | 48.6% |
| Interquartile Range (IQR) | 6.2% | 28.5% |
| Standard Deviation (Sample) | 7.2% | 26.2% |
| Standard Deviation (Population) | 7.2% | 24.7% |
Similar Demographics by Single Father Poverty
Demographics Similar to Ecuadorians by Single Father Poverty
In terms of single father poverty, the demographic groups most similar to Ecuadorians are Immigrants from Switzerland (16.5%, a difference of 0.010%), Cape Verdean (16.5%, a difference of 0.010%), Immigrants from Barbados (16.5%, a difference of 0.010%), Immigrants from Guyana (16.5%, a difference of 0.15%), and Immigrants from Canada (16.5%, a difference of 0.16%).
| Demographics | Rating | Rank | Single Father Poverty |
| Immigrants | Venezuela | 31.0 /100 | #186 | Fair 16.4% |
| Ukrainians | 30.4 /100 | #187 | Fair 16.4% |
| Russians | 30.1 /100 | #188 | Fair 16.4% |
| Latvians | 28.9 /100 | #189 | Fair 16.5% |
| Immigrants | Burma/Myanmar | 28.0 /100 | #190 | Fair 16.5% |
| Immigrants | Guyana | 27.1 /100 | #191 | Fair 16.5% |
| Immigrants | Switzerland | 24.8 /100 | #192 | Fair 16.5% |
| Ecuadorians | 24.5 /100 | #193 | Fair 16.5% |
| Cape Verdeans | 24.4 /100 | #194 | Fair 16.5% |
| Immigrants | Barbados | 24.3 /100 | #195 | Fair 16.5% |
| Immigrants | Canada | 21.9 /100 | #196 | Fair 16.5% |
| Immigrants | Northern Europe | 20.3 /100 | #197 | Fair 16.5% |
| Romanians | 20.1 /100 | #198 | Fair 16.5% |
| Immigrants | Belize | 19.8 /100 | #199 | Poor 16.5% |
| Syrians | 17.4 /100 | #200 | Poor 16.6% |
Demographics Similar to Alsatians by Single Father Poverty
In terms of single father poverty, the demographic groups most similar to Alsatians are Welsh (17.8%, a difference of 0.020%), English (17.8%, a difference of 0.10%), Dutch (17.8%, a difference of 0.10%), Immigrants from Lebanon (17.9%, a difference of 0.38%), and Scottish (17.7%, a difference of 0.42%).
| Demographics | Rating | Rank | Single Father Poverty |
| German Russians | 0.0 /100 | #276 | Tragic 17.7% |
| Lebanese | 0.0 /100 | #277 | Tragic 17.7% |
| Germans | 0.0 /100 | #278 | Tragic 17.7% |
| Iroquois | 0.0 /100 | #279 | Tragic 17.7% |
| Scottish | 0.0 /100 | #280 | Tragic 17.7% |
| English | 0.0 /100 | #281 | Tragic 17.8% |
| Dutch | 0.0 /100 | #282 | Tragic 17.8% |
| Alsatians | 0.0 /100 | #283 | Tragic 17.8% |
| Welsh | 0.0 /100 | #284 | Tragic 17.8% |
| Immigrants | Lebanon | 0.0 /100 | #285 | Tragic 17.9% |
| Immigrants | North Macedonia | 0.0 /100 | #286 | Tragic 17.9% |
| Carpatho Rusyns | 0.0 /100 | #287 | Tragic 18.0% |
| Bahamians | 0.0 /100 | #288 | Tragic 18.0% |
| Irish | 0.0 /100 | #289 | Tragic 18.0% |
| West Indians | 0.0 /100 | #290 | Tragic 18.0% |