Dutch West Indian vs Potawatomi Family Poverty
COMPARE
Dutch West Indian
Potawatomi
Family Poverty
Family Poverty Comparison
Dutch West Indians
Potawatomi
11.7%
FAMILY POVERTY
0.0/ 100
METRIC RATING
299th/ 347
METRIC RANK
10.2%
FAMILY POVERTY
1.5/ 100
METRIC RATING
239th/ 347
METRIC RANK
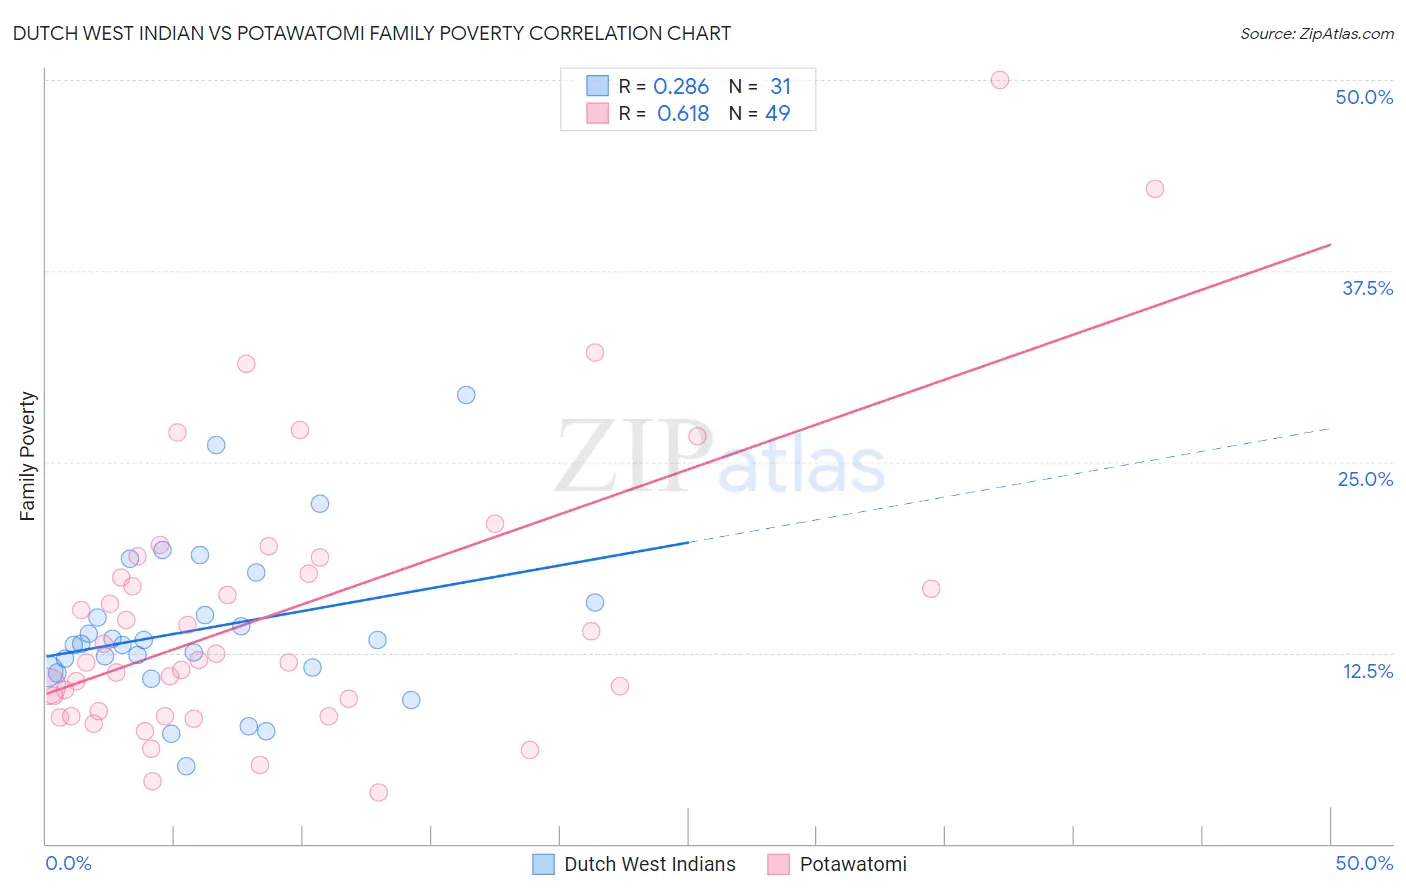
Dutch West Indian vs Potawatomi Family Poverty Correlation Chart
The statistical analysis conducted on geographies consisting of 85,756,421 people shows a weak positive correlation between the proportion of Dutch West Indians and poverty level among families in the United States with a correlation coefficient (R) of 0.286 and weighted average of 11.7%. Similarly, the statistical analysis conducted on geographies consisting of 117,705,487 people shows a significant positive correlation between the proportion of Potawatomi and poverty level among families in the United States with a correlation coefficient (R) of 0.618 and weighted average of 10.2%, a difference of 14.1%.
Family Poverty Correlation Summary
| Measurement | Dutch West Indian | Potawatomi |
| Minimum | 5.1% | 3.4% |
| Maximum | 29.4% | 50.0% |
| Range | 24.4% | 46.6% |
| Mean | 14.1% | 15.1% |
| Median | 13.1% | 12.0% |
| Interquartile 25% (IQ1) | 11.3% | 8.5% |
| Interquartile 75% (IQ3) | 15.8% | 18.2% |
| Interquartile Range (IQR) | 4.5% | 9.7% |
| Standard Deviation (Sample) | 5.2% | 9.4% |
| Standard Deviation (Population) | 5.1% | 9.3% |
Similar Demographics by Family Poverty
Demographics Similar to Dutch West Indians by Family Poverty
In terms of family poverty, the demographic groups most similar to Dutch West Indians are Immigrants from Bangladesh (11.7%, a difference of 0.010%), Immigrants from Senegal (11.7%, a difference of 0.10%), Creek (11.7%, a difference of 0.24%), Bahamian (11.7%, a difference of 0.27%), and Guatemalan (11.7%, a difference of 0.31%).
| Demographics | Rating | Rank | Family Poverty |
| Immigrants | Somalia | 0.0 /100 | #292 | Tragic 11.5% |
| Immigrants | Cabo Verde | 0.0 /100 | #293 | Tragic 11.6% |
| Immigrants | St. Vincent and the Grenadines | 0.0 /100 | #294 | Tragic 11.6% |
| Immigrants | Haiti | 0.0 /100 | #295 | Tragic 11.6% |
| Choctaw | 0.0 /100 | #296 | Tragic 11.6% |
| Creek | 0.0 /100 | #297 | Tragic 11.7% |
| Immigrants | Senegal | 0.0 /100 | #298 | Tragic 11.7% |
| Dutch West Indians | 0.0 /100 | #299 | Tragic 11.7% |
| Immigrants | Bangladesh | 0.0 /100 | #300 | Tragic 11.7% |
| Bahamians | 0.0 /100 | #301 | Tragic 11.7% |
| Guatemalans | 0.0 /100 | #302 | Tragic 11.7% |
| Africans | 0.0 /100 | #303 | Tragic 11.8% |
| Immigrants | Latin America | 0.0 /100 | #304 | Tragic 11.8% |
| Mexicans | 0.0 /100 | #305 | Tragic 11.8% |
| Cajuns | 0.0 /100 | #306 | Tragic 11.9% |
Demographics Similar to Potawatomi by Family Poverty
In terms of family poverty, the demographic groups most similar to Potawatomi are French American Indian (10.2%, a difference of 0.040%), Immigrants from the Azores (10.3%, a difference of 0.31%), Ghanaian (10.3%, a difference of 0.39%), Immigrants from Laos (10.2%, a difference of 0.40%), and Immigrants from Nigeria (10.2%, a difference of 0.67%).
| Demographics | Rating | Rank | Family Poverty |
| Immigrants | Sudan | 2.3 /100 | #232 | Tragic 10.1% |
| Fijians | 2.1 /100 | #233 | Tragic 10.1% |
| Immigrants | Middle Africa | 2.1 /100 | #234 | Tragic 10.1% |
| Nigerians | 2.0 /100 | #235 | Tragic 10.1% |
| Immigrants | Nigeria | 1.9 /100 | #236 | Tragic 10.2% |
| Immigrants | Laos | 1.7 /100 | #237 | Tragic 10.2% |
| French American Indians | 1.5 /100 | #238 | Tragic 10.2% |
| Potawatomi | 1.5 /100 | #239 | Tragic 10.2% |
| Immigrants | Azores | 1.4 /100 | #240 | Tragic 10.3% |
| Ghanaians | 1.3 /100 | #241 | Tragic 10.3% |
| Alaska Natives | 1.0 /100 | #242 | Tragic 10.4% |
| Nepalese | 0.8 /100 | #243 | Tragic 10.4% |
| Cree | 0.7 /100 | #244 | Tragic 10.5% |
| Immigrants | Burma/Myanmar | 0.6 /100 | #245 | Tragic 10.5% |
| Cherokee | 0.5 /100 | #246 | Tragic 10.6% |