Dutch vs Serbian Female Poverty
COMPARE
Dutch
Serbian
Female Poverty
Female Poverty Comparison
Dutch
Serbians
12.4%
FEMALE POVERTY
96.5/ 100
METRIC RATING
86th/ 347
METRIC RANK
12.3%
FEMALE POVERTY
97.2/ 100
METRIC RATING
77th/ 347
METRIC RANK
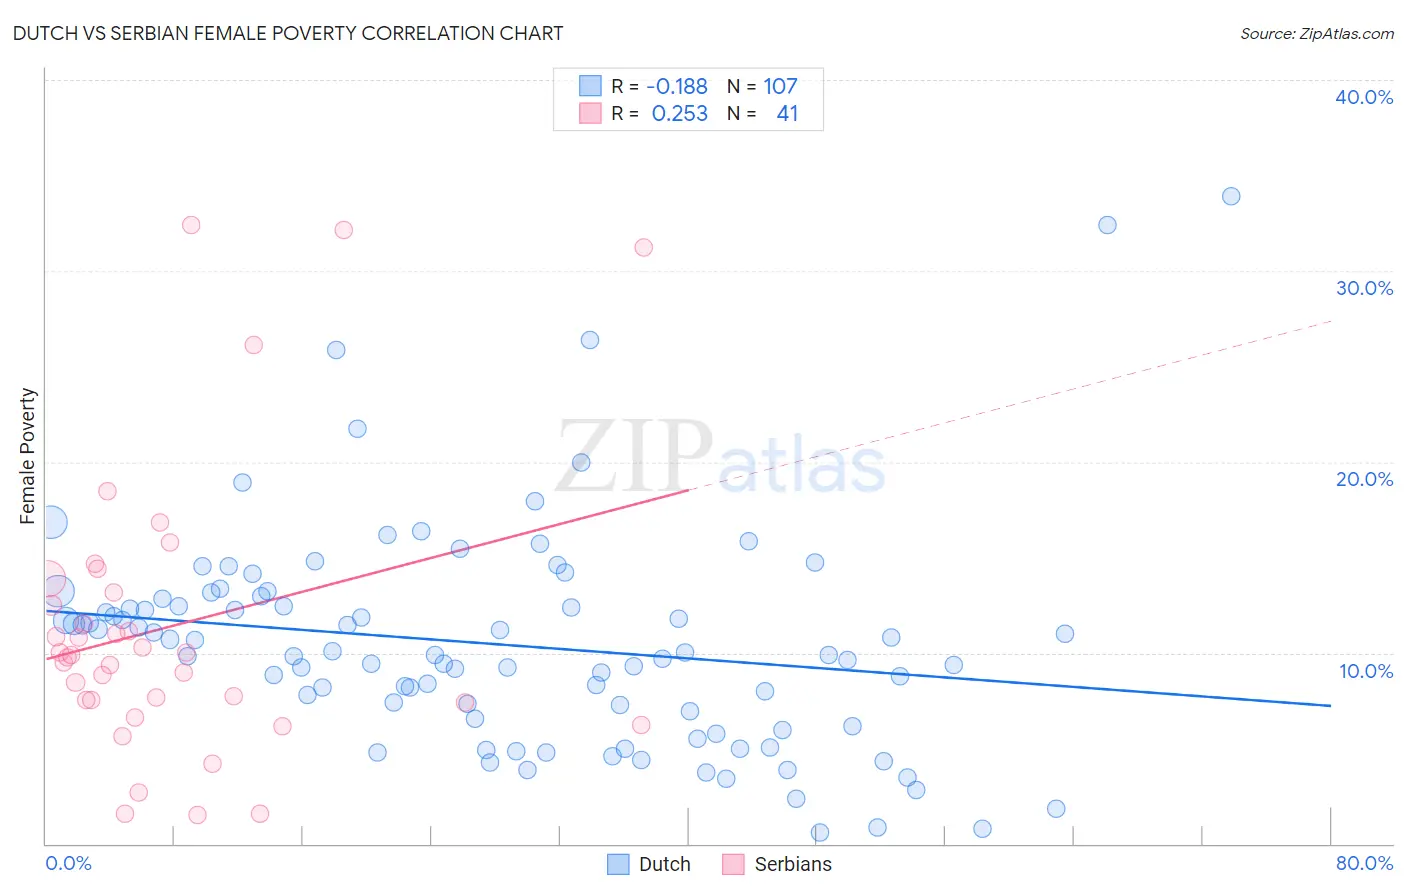
Dutch vs Serbian Female Poverty Correlation Chart
The statistical analysis conducted on geographies consisting of 553,347,784 people shows a poor negative correlation between the proportion of Dutch and poverty level among females in the United States with a correlation coefficient (R) of -0.188 and weighted average of 12.4%. Similarly, the statistical analysis conducted on geographies consisting of 267,492,629 people shows a weak positive correlation between the proportion of Serbians and poverty level among females in the United States with a correlation coefficient (R) of 0.253 and weighted average of 12.3%, a difference of 0.64%.
Female Poverty Correlation Summary
| Measurement | Dutch | Serbian |
| Minimum | 0.60% | 1.5% |
| Maximum | 33.9% | 32.4% |
| Range | 33.3% | 30.9% |
| Mean | 10.5% | 11.4% |
| Median | 9.9% | 9.9% |
| Interquartile 25% (IQ1) | 6.5% | 7.5% |
| Interquartile 75% (IQ3) | 12.8% | 13.5% |
| Interquartile Range (IQR) | 6.3% | 6.0% |
| Standard Deviation (Sample) | 5.8% | 7.5% |
| Standard Deviation (Population) | 5.7% | 7.4% |
Demographics Similar to Dutch and Serbians by Female Poverty
In terms of female poverty, the demographic groups most similar to Dutch are Okinawan (12.4%, a difference of 0.020%), Irish (12.4%, a difference of 0.030%), Finnish (12.4%, a difference of 0.060%), Northern European (12.4%, a difference of 0.080%), and English (12.4%, a difference of 0.26%). Similarly, the demographic groups most similar to Serbians are Egyptian (12.3%, a difference of 0.010%), Immigrants from Eastern Europe (12.3%, a difference of 0.030%), Immigrants from North America (12.3%, a difference of 0.080%), Slovak (12.3%, a difference of 0.13%), and Immigrants from Sweden (12.3%, a difference of 0.13%).
| Demographics | Rating | Rank | Female Poverty |
| Carpatho Rusyns | 97.6 /100 | #71 | Exceptional 12.2% |
| Cambodians | 97.5 /100 | #72 | Exceptional 12.2% |
| Zimbabweans | 97.5 /100 | #73 | Exceptional 12.3% |
| Immigrants | Canada | 97.5 /100 | #74 | Exceptional 12.3% |
| Europeans | 97.4 /100 | #75 | Exceptional 12.3% |
| Immigrants | Eastern Europe | 97.2 /100 | #76 | Exceptional 12.3% |
| Serbians | 97.2 /100 | #77 | Exceptional 12.3% |
| Egyptians | 97.2 /100 | #78 | Exceptional 12.3% |
| Immigrants | North America | 97.1 /100 | #79 | Exceptional 12.3% |
| Slovaks | 97.1 /100 | #80 | Exceptional 12.3% |
| Immigrants | Sweden | 97.1 /100 | #81 | Exceptional 12.3% |
| Jordanians | 97.1 /100 | #82 | Exceptional 12.3% |
| Immigrants | England | 96.9 /100 | #83 | Exceptional 12.3% |
| Northern Europeans | 96.6 /100 | #84 | Exceptional 12.4% |
| Irish | 96.5 /100 | #85 | Exceptional 12.4% |
| Dutch | 96.5 /100 | #86 | Exceptional 12.4% |
| Okinawans | 96.4 /100 | #87 | Exceptional 12.4% |
| Finns | 96.4 /100 | #88 | Exceptional 12.4% |
| English | 96.1 /100 | #89 | Exceptional 12.4% |
| Immigrants | Denmark | 95.8 /100 | #90 | Exceptional 12.4% |
| Belgians | 95.8 /100 | #91 | Exceptional 12.4% |