Czechoslovakian vs Slavic Child Poverty Among Boys Under 16
COMPARE
Czechoslovakian
Slavic
Child Poverty Among Boys Under 16
Child Poverty Among Boys Under 16 Comparison
Czechoslovakians
Slavs
15.3%
CHILD POVERTY AMONG BOYS UNDER 16
92.1/ 100
METRIC RATING
125th/ 347
METRIC RANK
15.7%
CHILD POVERTY AMONG BOYS UNDER 16
84.5/ 100
METRIC RATING
141st/ 347
METRIC RANK
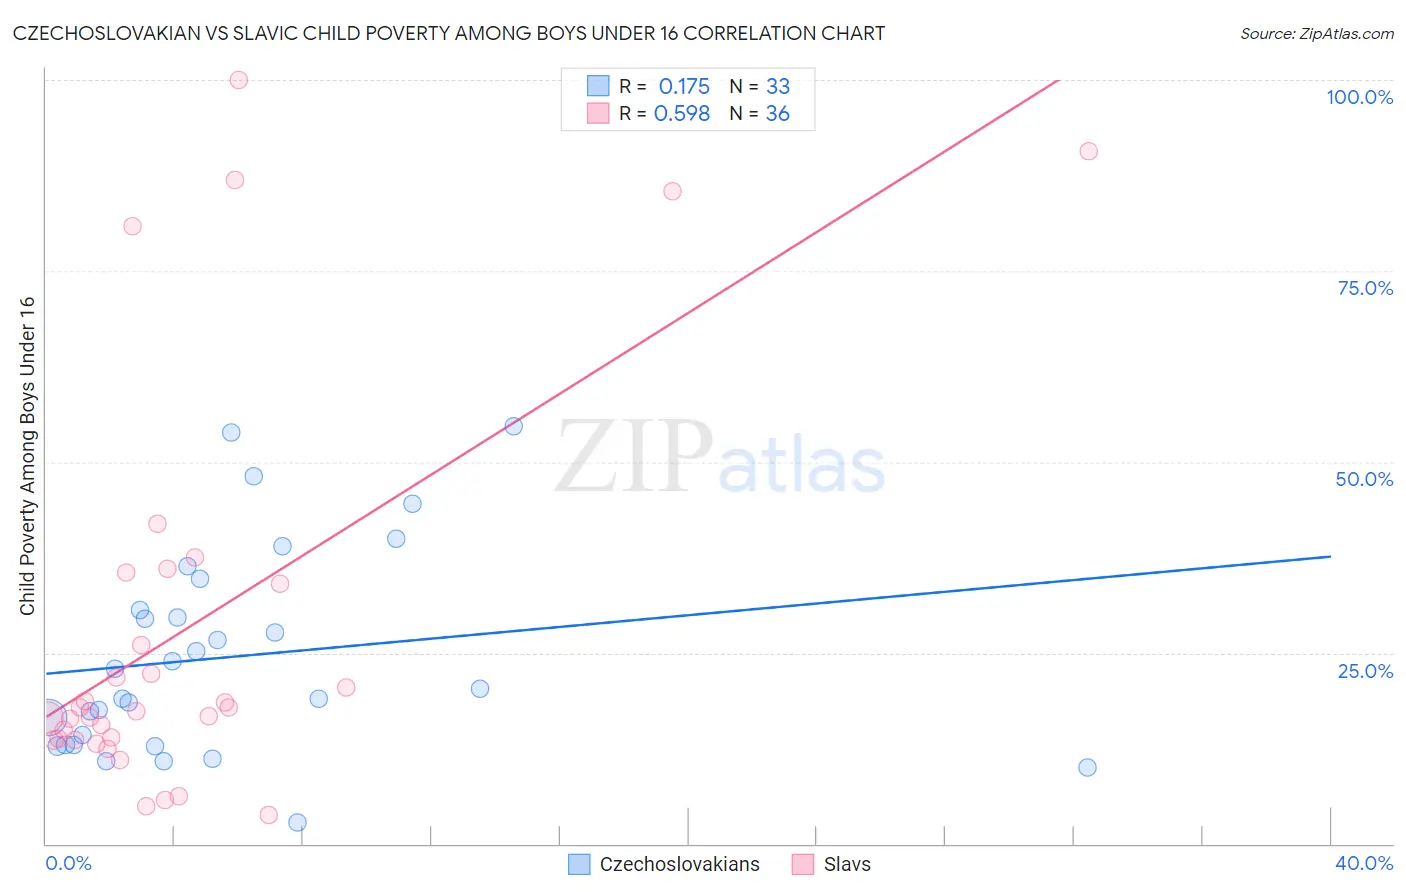
Czechoslovakian vs Slavic Child Poverty Among Boys Under 16 Correlation Chart
The statistical analysis conducted on geographies consisting of 361,979,827 people shows a poor positive correlation between the proportion of Czechoslovakians and poverty level among boys under the age of 16 in the United States with a correlation coefficient (R) of 0.175 and weighted average of 15.3%. Similarly, the statistical analysis conducted on geographies consisting of 267,135,451 people shows a substantial positive correlation between the proportion of Slavs and poverty level among boys under the age of 16 in the United States with a correlation coefficient (R) of 0.598 and weighted average of 15.7%, a difference of 2.3%.
Child Poverty Among Boys Under 16 Correlation Summary
| Measurement | Czechoslovakian | Slavic |
| Minimum | 2.7% | 3.7% |
| Maximum | 54.7% | 100.0% |
| Range | 51.9% | 96.3% |
| Mean | 24.4% | 28.3% |
| Median | 20.3% | 17.6% |
| Interquartile 25% (IQ1) | 13.0% | 13.7% |
| Interquartile 75% (IQ3) | 32.7% | 34.8% |
| Interquartile Range (IQR) | 19.7% | 21.1% |
| Standard Deviation (Sample) | 13.3% | 26.3% |
| Standard Deviation (Population) | 13.1% | 26.0% |
Demographics Similar to Czechoslovakians and Slavs by Child Poverty Among Boys Under 16
In terms of child poverty among boys under 16, the demographic groups most similar to Czechoslovakians are Tlingit-Haida (15.3%, a difference of 0.070%), Immigrants from Norway (15.3%, a difference of 0.080%), Palestinian (15.4%, a difference of 0.31%), Carpatho Rusyn (15.4%, a difference of 0.36%), and Canadian (15.4%, a difference of 0.55%). Similarly, the demographic groups most similar to Slavs are Immigrants from Hungary (15.7%, a difference of 0.090%), Immigrants from Fiji (15.7%, a difference of 0.19%), Immigrants from Kuwait (15.6%, a difference of 0.26%), Albanian (15.6%, a difference of 0.48%), and Immigrants from Southern Europe (15.6%, a difference of 0.49%).
| Demographics | Rating | Rank | Child Poverty Among Boys Under 16 |
| Immigrants | Norway | 92.3 /100 | #123 | Exceptional 15.3% |
| Tlingit-Haida | 92.2 /100 | #124 | Exceptional 15.3% |
| Czechoslovakians | 92.1 /100 | #125 | Exceptional 15.3% |
| Palestinians | 91.3 /100 | #126 | Exceptional 15.4% |
| Carpatho Rusyns | 91.1 /100 | #127 | Exceptional 15.4% |
| Canadians | 90.6 /100 | #128 | Exceptional 15.4% |
| Immigrants | Brazil | 90.3 /100 | #129 | Exceptional 15.4% |
| Mongolians | 90.2 /100 | #130 | Exceptional 15.4% |
| Immigrants | Western Europe | 90.0 /100 | #131 | Exceptional 15.4% |
| Immigrants | Kazakhstan | 88.7 /100 | #132 | Excellent 15.5% |
| Welsh | 88.3 /100 | #133 | Excellent 15.5% |
| Peruvians | 88.1 /100 | #134 | Excellent 15.5% |
| Portuguese | 87.5 /100 | #135 | Excellent 15.5% |
| Icelanders | 87.5 /100 | #136 | Excellent 15.5% |
| Immigrants | Spain | 87.1 /100 | #137 | Excellent 15.6% |
| Immigrants | Southern Europe | 86.5 /100 | #138 | Excellent 15.6% |
| Albanians | 86.5 /100 | #139 | Excellent 15.6% |
| Immigrants | Kuwait | 85.6 /100 | #140 | Excellent 15.6% |
| Slavs | 84.5 /100 | #141 | Excellent 15.7% |
| Immigrants | Hungary | 84.1 /100 | #142 | Excellent 15.7% |
| Immigrants | Fiji | 83.6 /100 | #143 | Excellent 15.7% |