Crow vs Immigrants from South America Receiving Food Stamps
COMPARE
Crow
Immigrants from South America
Receiving Food Stamps
Receiving Food Stamps Comparison
Crow
Immigrants from South America
13.4%
RECEIVING FOOD STAMPS
1.6/ 100
METRIC RATING
236th/ 347
METRIC RANK
12.8%
RECEIVING FOOD STAMPS
6.5/ 100
METRIC RATING
216th/ 347
METRIC RANK
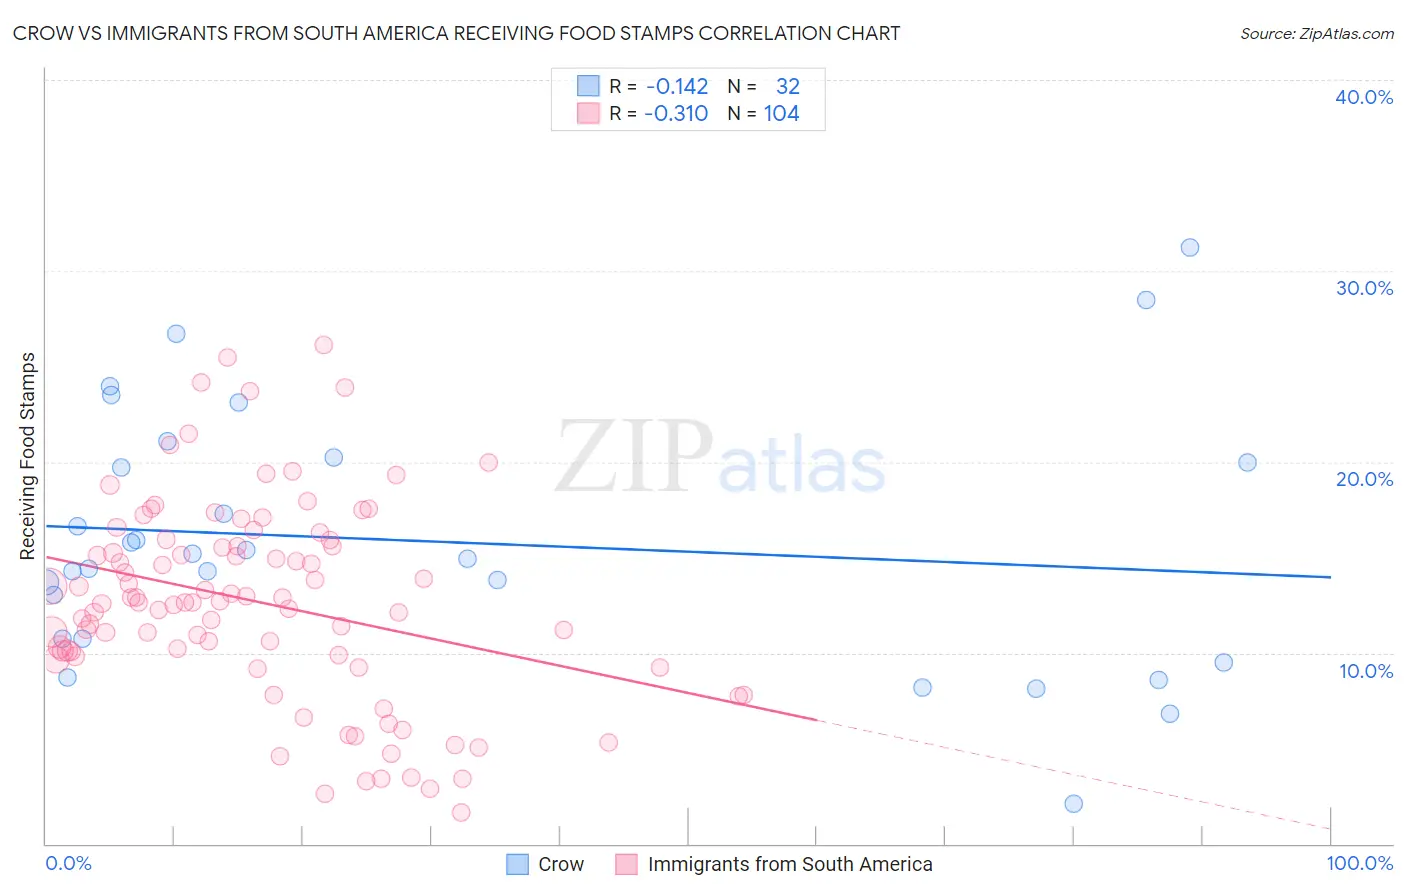
Crow vs Immigrants from South America Receiving Food Stamps Correlation Chart
The statistical analysis conducted on geographies consisting of 59,190,745 people shows a poor negative correlation between the proportion of Crow and percentage of population receiving government assistance and/or food stamps in the United States with a correlation coefficient (R) of -0.142 and weighted average of 13.4%. Similarly, the statistical analysis conducted on geographies consisting of 484,382,726 people shows a mild negative correlation between the proportion of Immigrants from South America and percentage of population receiving government assistance and/or food stamps in the United States with a correlation coefficient (R) of -0.310 and weighted average of 12.8%, a difference of 4.6%.
Receiving Food Stamps Correlation Summary
| Measurement | Crow | Immigrants from South America |
| Minimum | 2.1% | 1.7% |
| Maximum | 31.2% | 26.1% |
| Range | 29.1% | 24.5% |
| Mean | 15.8% | 12.6% |
| Median | 15.0% | 12.6% |
| Interquartile 25% (IQ1) | 10.7% | 9.9% |
| Interquartile 75% (IQ3) | 20.1% | 15.8% |
| Interquartile Range (IQR) | 9.4% | 5.9% |
| Standard Deviation (Sample) | 6.7% | 5.3% |
| Standard Deviation (Population) | 6.6% | 5.2% |
Demographics Similar to Crow and Immigrants from South America by Receiving Food Stamps
In terms of receiving food stamps, the demographic groups most similar to Crow are Immigrants from Zaire (13.4%, a difference of 0.44%), Comanche (13.3%, a difference of 1.2%), Cherokee (13.2%, a difference of 1.3%), Salvadoran (13.2%, a difference of 1.6%), and Immigrants from Nigeria (13.1%, a difference of 2.4%). Similarly, the demographic groups most similar to Immigrants from South America are Immigrants from Burma/Myanmar (12.9%, a difference of 0.26%), Hawaiian (12.9%, a difference of 0.63%), Immigrants from Middle Africa (12.9%, a difference of 0.64%), Immigrants from Colombia (12.9%, a difference of 0.67%), and Bermudan (13.0%, a difference of 1.0%).
| Demographics | Rating | Rank | Receiving Food Stamps |
| Immigrants | South America | 6.5 /100 | #216 | Tragic 12.8% |
| Immigrants | Burma/Myanmar | 6.0 /100 | #217 | Tragic 12.9% |
| Hawaiians | 5.4 /100 | #218 | Tragic 12.9% |
| Immigrants | Middle Africa | 5.4 /100 | #219 | Tragic 12.9% |
| Immigrants | Colombia | 5.3 /100 | #220 | Tragic 12.9% |
| Bermudans | 4.8 /100 | #221 | Tragic 13.0% |
| Immigrants | Immigrants | 4.4 /100 | #222 | Tragic 13.0% |
| Immigrants | Albania | 4.4 /100 | #223 | Tragic 13.0% |
| Immigrants | Armenia | 4.3 /100 | #224 | Tragic 13.0% |
| Fijians | 4.3 /100 | #225 | Tragic 13.0% |
| Chickasaw | 3.6 /100 | #226 | Tragic 13.1% |
| Nigerians | 3.5 /100 | #227 | Tragic 13.1% |
| Panamanians | 3.5 /100 | #228 | Tragic 13.1% |
| Ottawa | 3.5 /100 | #229 | Tragic 13.1% |
| Puget Sound Salish | 3.4 /100 | #230 | Tragic 13.1% |
| Immigrants | Nigeria | 3.4 /100 | #231 | Tragic 13.1% |
| Salvadorans | 2.7 /100 | #232 | Tragic 13.2% |
| Cherokee | 2.5 /100 | #233 | Tragic 13.2% |
| Comanche | 2.4 /100 | #234 | Tragic 13.3% |
| Immigrants | Zaire | 1.9 /100 | #235 | Tragic 13.4% |
| Crow | 1.6 /100 | #236 | Tragic 13.4% |