Cree vs Immigrants from Belgium Child Poverty Under the Age of 5
COMPARE
Cree
Immigrants from Belgium
Child Poverty Under the Age of 5
Child Poverty Under the Age of 5 Comparison
Cree
Immigrants from Belgium
19.7%
CHILD POVERTY UNDER THE AGE OF 5
0.4/ 100
METRIC RATING
246th/ 347
METRIC RANK
15.3%
CHILD POVERTY UNDER THE AGE OF 5
98.8/ 100
METRIC RATING
70th/ 347
METRIC RANK
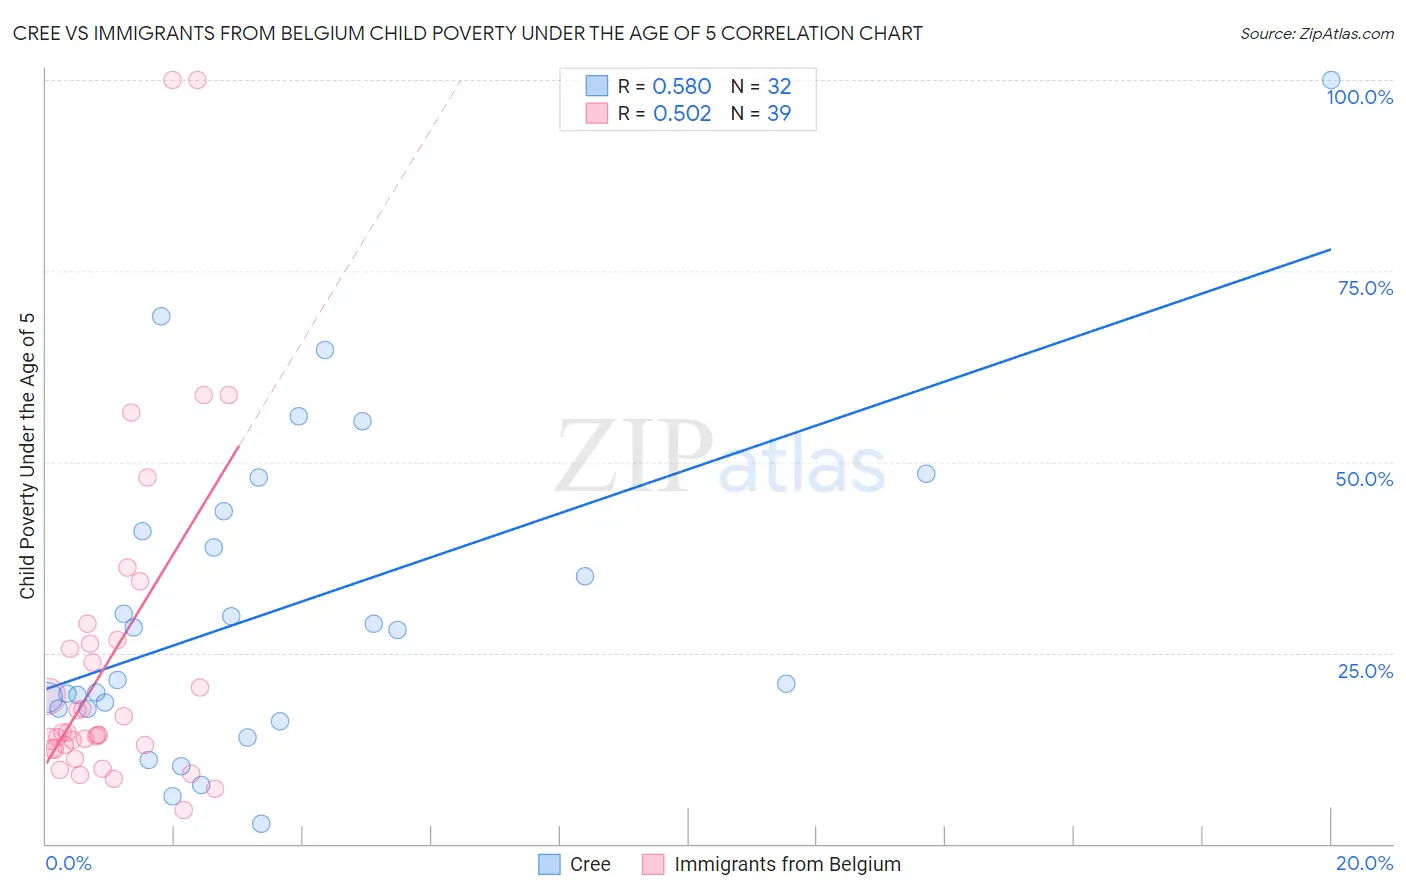
Cree vs Immigrants from Belgium Child Poverty Under the Age of 5 Correlation Chart
The statistical analysis conducted on geographies consisting of 75,401,042 people shows a substantial positive correlation between the proportion of Cree and poverty level among children under the age of 5 in the United States with a correlation coefficient (R) of 0.580 and weighted average of 19.7%. Similarly, the statistical analysis conducted on geographies consisting of 142,468,975 people shows a substantial positive correlation between the proportion of Immigrants from Belgium and poverty level among children under the age of 5 in the United States with a correlation coefficient (R) of 0.502 and weighted average of 15.3%, a difference of 29.1%.
Child Poverty Under the Age of 5 Correlation Summary
| Measurement | Cree | Immigrants from Belgium |
| Minimum | 2.6% | 4.3% |
| Maximum | 100.0% | 100.0% |
| Range | 97.4% | 95.7% |
| Mean | 30.8% | 24.7% |
| Median | 24.7% | 14.5% |
| Interquartile 25% (IQ1) | 17.7% | 12.4% |
| Interquartile 75% (IQ3) | 42.2% | 26.7% |
| Interquartile Range (IQR) | 24.5% | 14.3% |
| Standard Deviation (Sample) | 21.3% | 22.6% |
| Standard Deviation (Population) | 20.9% | 22.3% |
Similar Demographics by Child Poverty Under the Age of 5
Demographics Similar to Cree by Child Poverty Under the Age of 5
In terms of child poverty under the age of 5, the demographic groups most similar to Cree are Immigrants from Western Africa (19.7%, a difference of 0.070%), Guyanese (19.7%, a difference of 0.16%), Marshallese (19.7%, a difference of 0.17%), Immigrants from Middle Africa (19.7%, a difference of 0.19%), and Nonimmigrants (19.7%, a difference of 0.24%).
| Demographics | Rating | Rank | Child Poverty Under the Age of 5 |
| Vietnamese | 0.6 /100 | #239 | Tragic 19.5% |
| Immigrants | Ecuador | 0.5 /100 | #240 | Tragic 19.6% |
| Alaska Natives | 0.5 /100 | #241 | Tragic 19.6% |
| Immigrants | Guyana | 0.5 /100 | #242 | Tragic 19.6% |
| Osage | 0.5 /100 | #243 | Tragic 19.6% |
| Immigrants | Ghana | 0.5 /100 | #244 | Tragic 19.6% |
| Immigrants | Western Africa | 0.4 /100 | #245 | Tragic 19.7% |
| Cree | 0.4 /100 | #246 | Tragic 19.7% |
| Guyanese | 0.4 /100 | #247 | Tragic 19.7% |
| Marshallese | 0.4 /100 | #248 | Tragic 19.7% |
| Immigrants | Middle Africa | 0.4 /100 | #249 | Tragic 19.7% |
| Immigrants | Nonimmigrants | 0.4 /100 | #250 | Tragic 19.7% |
| Pennsylvania Germans | 0.3 /100 | #251 | Tragic 19.8% |
| Immigrants | Nicaragua | 0.3 /100 | #252 | Tragic 19.8% |
| Mexican American Indians | 0.3 /100 | #253 | Tragic 19.9% |
Demographics Similar to Immigrants from Belgium by Child Poverty Under the Age of 5
In terms of child poverty under the age of 5, the demographic groups most similar to Immigrants from Belgium are Immigrants from Egypt (15.3%, a difference of 0.0%), Immigrants from Sweden (15.3%, a difference of 0.070%), Immigrants from Ukraine (15.3%, a difference of 0.30%), Lithuanian (15.2%, a difference of 0.43%), and Greek (15.2%, a difference of 0.45%).
| Demographics | Rating | Rank | Child Poverty Under the Age of 5 |
| Immigrants | Europe | 99.1 /100 | #63 | Exceptional 15.1% |
| Immigrants | Romania | 99.1 /100 | #64 | Exceptional 15.2% |
| Immigrants | Fiji | 99.0 /100 | #65 | Exceptional 15.2% |
| Immigrants | Scotland | 99.0 /100 | #66 | Exceptional 15.2% |
| Greeks | 99.0 /100 | #67 | Exceptional 15.2% |
| Zimbabweans | 99.0 /100 | #68 | Exceptional 15.2% |
| Lithuanians | 99.0 /100 | #69 | Exceptional 15.2% |
| Immigrants | Belgium | 98.8 /100 | #70 | Exceptional 15.3% |
| Immigrants | Egypt | 98.8 /100 | #71 | Exceptional 15.3% |
| Immigrants | Sweden | 98.8 /100 | #72 | Exceptional 15.3% |
| Immigrants | Ukraine | 98.7 /100 | #73 | Exceptional 15.3% |
| Argentineans | 98.5 /100 | #74 | Exceptional 15.4% |
| Immigrants | Argentina | 98.5 /100 | #75 | Exceptional 15.4% |
| Croatians | 98.5 /100 | #76 | Exceptional 15.4% |
| Immigrants | Turkey | 98.3 /100 | #77 | Exceptional 15.4% |