Cree vs Fijian Seniors Poverty Over the Age of 65
COMPARE
Cree
Fijian
Seniors Poverty Over the Age of 65
Seniors Poverty Over the Age of 65 Comparison
Cree
Fijians
12.1%
SENIORS POVERTY OVER THE AGE OF 65
0.7/ 100
METRIC RATING
246th/ 347
METRIC RANK
10.7%
SENIORS POVERTY OVER THE AGE OF 65
75.6/ 100
METRIC RATING
153rd/ 347
METRIC RANK
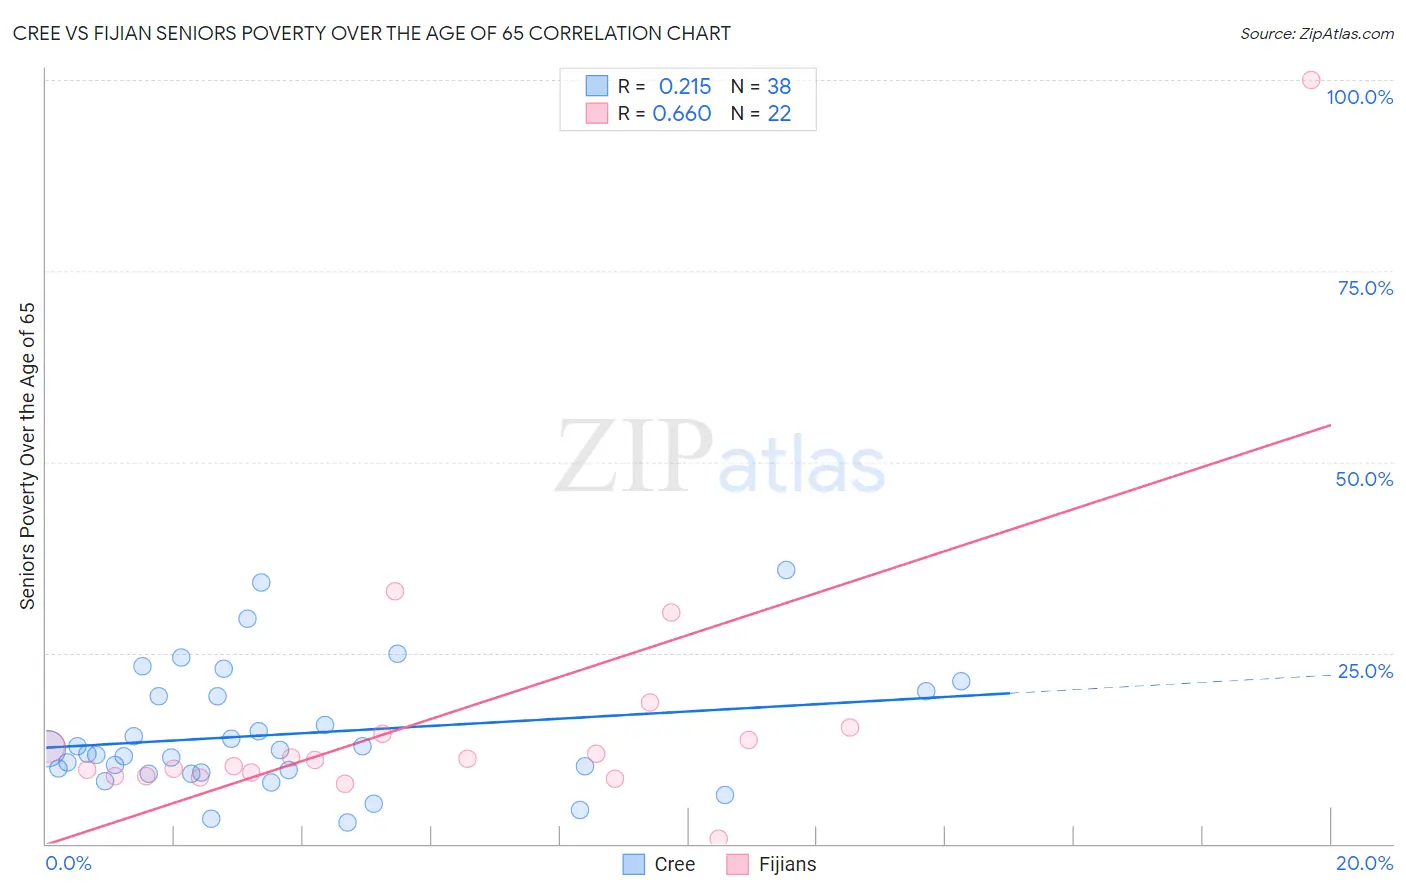
Cree vs Fijian Seniors Poverty Over the Age of 65 Correlation Chart
The statistical analysis conducted on geographies consisting of 76,178,735 people shows a weak positive correlation between the proportion of Cree and poverty level among seniors over the age of 65 in the United States with a correlation coefficient (R) of 0.215 and weighted average of 12.1%. Similarly, the statistical analysis conducted on geographies consisting of 55,831,768 people shows a significant positive correlation between the proportion of Fijians and poverty level among seniors over the age of 65 in the United States with a correlation coefficient (R) of 0.660 and weighted average of 10.7%, a difference of 13.9%.
Seniors Poverty Over the Age of 65 Correlation Summary
| Measurement | Cree | Fijian |
| Minimum | 2.8% | 0.60% |
| Maximum | 35.9% | 100.0% |
| Range | 33.1% | 99.4% |
| Mean | 14.4% | 16.6% |
| Median | 12.1% | 11.0% |
| Interquartile 25% (IQ1) | 9.3% | 8.9% |
| Interquartile 75% (IQ3) | 19.3% | 14.4% |
| Interquartile Range (IQR) | 10.0% | 5.5% |
| Standard Deviation (Sample) | 8.0% | 19.9% |
| Standard Deviation (Population) | 7.9% | 19.5% |
Similar Demographics by Seniors Poverty Over the Age of 65
Demographics Similar to Cree by Seniors Poverty Over the Age of 65
In terms of seniors poverty over the age of 65, the demographic groups most similar to Cree are Chippewa (12.1%, a difference of 0.11%), Japanese (12.2%, a difference of 0.11%), Spanish American (12.2%, a difference of 0.12%), Ute (12.2%, a difference of 0.17%), and Immigrants from Portugal (12.1%, a difference of 0.22%).
| Demographics | Rating | Rank | Seniors Poverty Over the Age of 65 |
| Immigrants | Spain | 1.0 /100 | #239 | Tragic 12.1% |
| Comanche | 0.9 /100 | #240 | Tragic 12.1% |
| Immigrants | Albania | 0.9 /100 | #241 | Tragic 12.1% |
| Sub-Saharan Africans | 0.9 /100 | #242 | Tragic 12.1% |
| Uruguayans | 0.8 /100 | #243 | Tragic 12.1% |
| Immigrants | Portugal | 0.8 /100 | #244 | Tragic 12.1% |
| Chippewa | 0.7 /100 | #245 | Tragic 12.1% |
| Cree | 0.7 /100 | #246 | Tragic 12.1% |
| Japanese | 0.6 /100 | #247 | Tragic 12.2% |
| Spanish Americans | 0.6 /100 | #248 | Tragic 12.2% |
| Ute | 0.6 /100 | #249 | Tragic 12.2% |
| Immigrants | Liberia | 0.5 /100 | #250 | Tragic 12.2% |
| Somalis | 0.3 /100 | #251 | Tragic 12.3% |
| Armenians | 0.3 /100 | #252 | Tragic 12.3% |
| Shoshone | 0.3 /100 | #253 | Tragic 12.3% |
Demographics Similar to Fijians by Seniors Poverty Over the Age of 65
In terms of seniors poverty over the age of 65, the demographic groups most similar to Fijians are Immigrants from Saudi Arabia (10.7%, a difference of 0.080%), Immigrants from Egypt (10.6%, a difference of 0.11%), Spanish (10.6%, a difference of 0.15%), Immigrants from Switzerland (10.6%, a difference of 0.22%), and Chickasaw (10.7%, a difference of 0.24%).
| Demographics | Rating | Rank | Seniors Poverty Over the Age of 65 |
| Alaskan Athabascans | 79.1 /100 | #146 | Good 10.6% |
| Immigrants | Greece | 79.0 /100 | #147 | Good 10.6% |
| Americans | 78.1 /100 | #148 | Good 10.6% |
| Immigrants | Cameroon | 78.1 /100 | #149 | Good 10.6% |
| Immigrants | Switzerland | 77.3 /100 | #150 | Good 10.6% |
| Spanish | 76.8 /100 | #151 | Good 10.6% |
| Immigrants | Egypt | 76.5 /100 | #152 | Good 10.6% |
| Fijians | 75.6 /100 | #153 | Good 10.7% |
| Immigrants | Saudi Arabia | 74.9 /100 | #154 | Good 10.7% |
| Chickasaw | 73.6 /100 | #155 | Good 10.7% |
| Ethiopians | 72.9 /100 | #156 | Good 10.7% |
| Immigrants | Ethiopia | 72.9 /100 | #157 | Good 10.7% |
| Immigrants | Sierra Leone | 71.7 /100 | #158 | Good 10.7% |
| Immigrants | Micronesia | 70.8 /100 | #159 | Good 10.7% |
| Sudanese | 68.2 /100 | #160 | Good 10.7% |