Chinese vs Immigrants from Iraq Child Poverty Under the Age of 16
COMPARE
Chinese
Immigrants from Iraq
Child Poverty Under the Age of 16
Child Poverty Under the Age of 16 Comparison
Chinese
Immigrants from Iraq
11.9%
CHILD POVERTY UNDER THE AGE OF 16
100.0/ 100
METRIC RATING
5th/ 347
METRIC RANK
16.7%
CHILD POVERTY UNDER THE AGE OF 16
28.3/ 100
METRIC RATING
191st/ 347
METRIC RANK
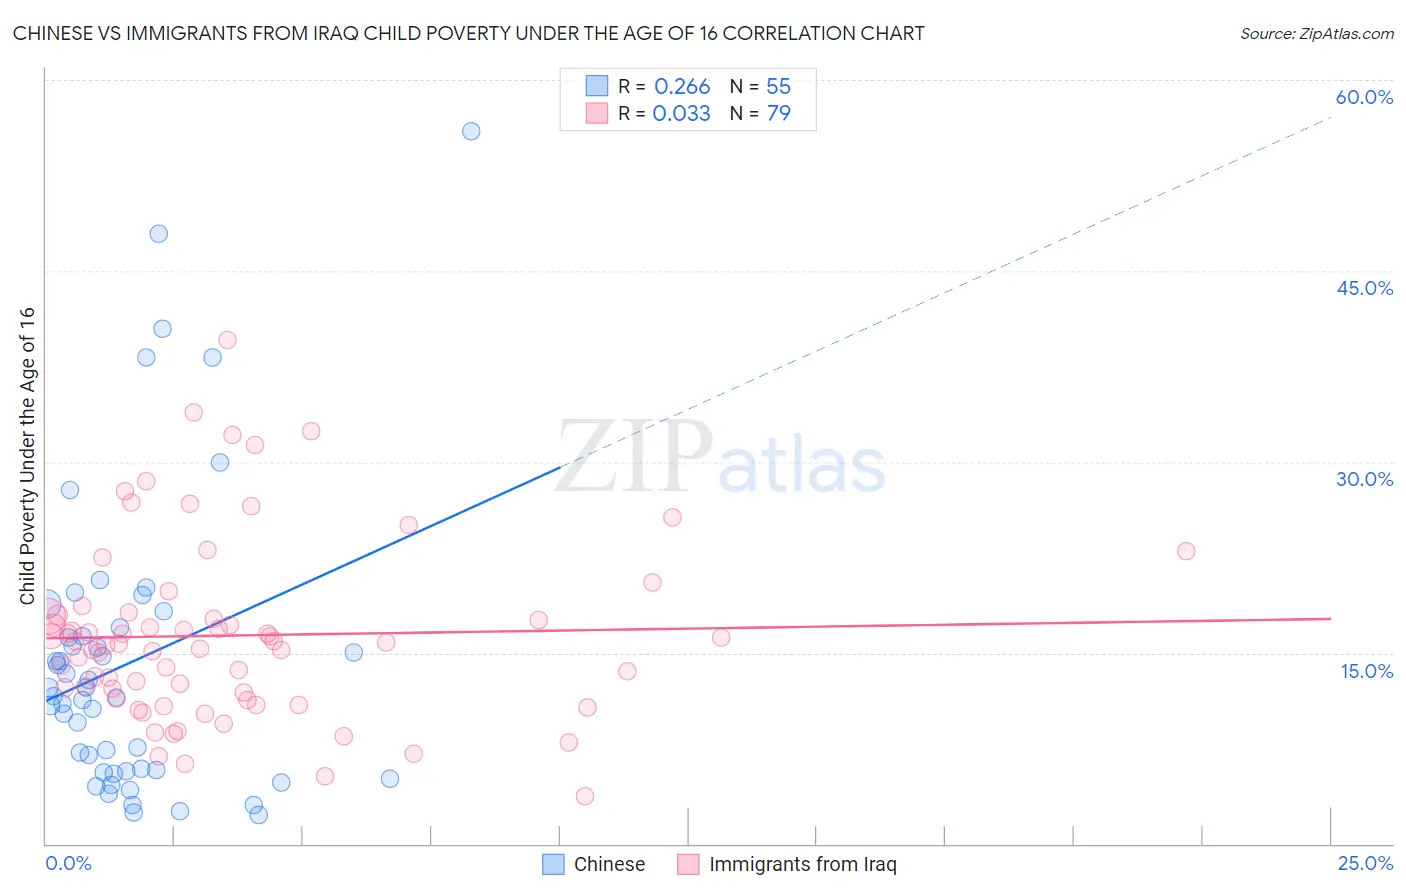
Chinese vs Immigrants from Iraq Child Poverty Under the Age of 16 Correlation Chart
The statistical analysis conducted on geographies consisting of 64,759,689 people shows a weak positive correlation between the proportion of Chinese and poverty level among children under the age of 16 in the United States with a correlation coefficient (R) of 0.266 and weighted average of 11.9%. Similarly, the statistical analysis conducted on geographies consisting of 194,097,606 people shows no correlation between the proportion of Immigrants from Iraq and poverty level among children under the age of 16 in the United States with a correlation coefficient (R) of 0.033 and weighted average of 16.7%, a difference of 39.7%.
Child Poverty Under the Age of 16 Correlation Summary
| Measurement | Chinese | Immigrants from Iraq |
| Minimum | 2.3% | 3.8% |
| Maximum | 56.0% | 39.5% |
| Range | 53.7% | 35.8% |
| Mean | 14.3% | 16.4% |
| Median | 11.6% | 15.7% |
| Interquartile 25% (IQ1) | 5.7% | 11.4% |
| Interquartile 75% (IQ3) | 17.0% | 18.0% |
| Interquartile Range (IQR) | 11.3% | 6.6% |
| Standard Deviation (Sample) | 11.6% | 7.0% |
| Standard Deviation (Population) | 11.5% | 7.0% |
Similar Demographics by Child Poverty Under the Age of 16
Demographics Similar to Chinese by Child Poverty Under the Age of 16
In terms of child poverty under the age of 16, the demographic groups most similar to Chinese are Immigrants from Hong Kong (12.1%, a difference of 1.8%), Iranian (12.2%, a difference of 2.6%), Thai (11.6%, a difference of 3.1%), Immigrants from Singapore (12.4%, a difference of 3.7%), and Immigrants from Iran (12.4%, a difference of 3.8%).
| Demographics | Rating | Rank | Child Poverty Under the Age of 16 |
| Immigrants | India | 100.0 /100 | #1 | Exceptional 10.8% |
| Immigrants | Taiwan | 100.0 /100 | #2 | Exceptional 11.0% |
| Filipinos | 100.0 /100 | #3 | Exceptional 11.1% |
| Thais | 100.0 /100 | #4 | Exceptional 11.6% |
| Chinese | 100.0 /100 | #5 | Exceptional 11.9% |
| Immigrants | Hong Kong | 100.0 /100 | #6 | Exceptional 12.1% |
| Iranians | 100.0 /100 | #7 | Exceptional 12.2% |
| Immigrants | Singapore | 100.0 /100 | #8 | Exceptional 12.4% |
| Immigrants | Iran | 100.0 /100 | #9 | Exceptional 12.4% |
| Immigrants | South Central Asia | 99.9 /100 | #10 | Exceptional 12.5% |
| Bhutanese | 99.9 /100 | #11 | Exceptional 12.5% |
| Immigrants | Ireland | 99.9 /100 | #12 | Exceptional 12.7% |
| Burmese | 99.9 /100 | #13 | Exceptional 12.8% |
| Immigrants | Lithuania | 99.9 /100 | #14 | Exceptional 12.9% |
| Immigrants | Korea | 99.9 /100 | #15 | Exceptional 13.0% |
Demographics Similar to Immigrants from Iraq by Child Poverty Under the Age of 16
In terms of child poverty under the age of 16, the demographic groups most similar to Immigrants from Iraq are Immigrants from Costa Rica (16.6%, a difference of 0.19%), Immigrants from Portugal (16.6%, a difference of 0.25%), Immigrants from Morocco (16.6%, a difference of 0.42%), Arab (16.6%, a difference of 0.44%), and Spanish (16.7%, a difference of 0.57%).
| Demographics | Rating | Rank | Child Poverty Under the Age of 16 |
| Immigrants | Western Asia | 38.0 /100 | #184 | Fair 16.4% |
| Immigrants | Bosnia and Herzegovina | 37.4 /100 | #185 | Fair 16.5% |
| Kenyans | 34.1 /100 | #186 | Fair 16.5% |
| Arabs | 31.4 /100 | #187 | Fair 16.6% |
| Immigrants | Morocco | 31.2 /100 | #188 | Fair 16.6% |
| Immigrants | Portugal | 30.0 /100 | #189 | Fair 16.6% |
| Immigrants | Costa Rica | 29.6 /100 | #190 | Fair 16.6% |
| Immigrants | Iraq | 28.3 /100 | #191 | Fair 16.7% |
| Spanish | 24.5 /100 | #192 | Fair 16.7% |
| Spaniards | 23.2 /100 | #193 | Fair 16.8% |
| Immigrants | Uruguay | 23.1 /100 | #194 | Fair 16.8% |
| Immigrants | Uganda | 22.5 /100 | #195 | Fair 16.8% |
| Immigrants | Lebanon | 22.0 /100 | #196 | Fair 16.8% |
| Immigrants | Kenya | 19.1 /100 | #197 | Poor 16.9% |
| Delaware | 17.1 /100 | #198 | Poor 17.0% |