Chilean vs Bangladeshi Female Poverty Among 25-34 Year Olds
COMPARE
Chilean
Bangladeshi
Female Poverty Among 25-34 Year Olds
Female Poverty Among 25-34 Year Olds Comparison
Chileans
Bangladeshis
12.8%
FEMALE POVERTY AMONG 25-34 YEAR OLDS
93.2/ 100
METRIC RATING
116th/ 347
METRIC RANK
15.9%
FEMALE POVERTY AMONG 25-34 YEAR OLDS
0.0/ 100
METRIC RATING
280th/ 347
METRIC RANK
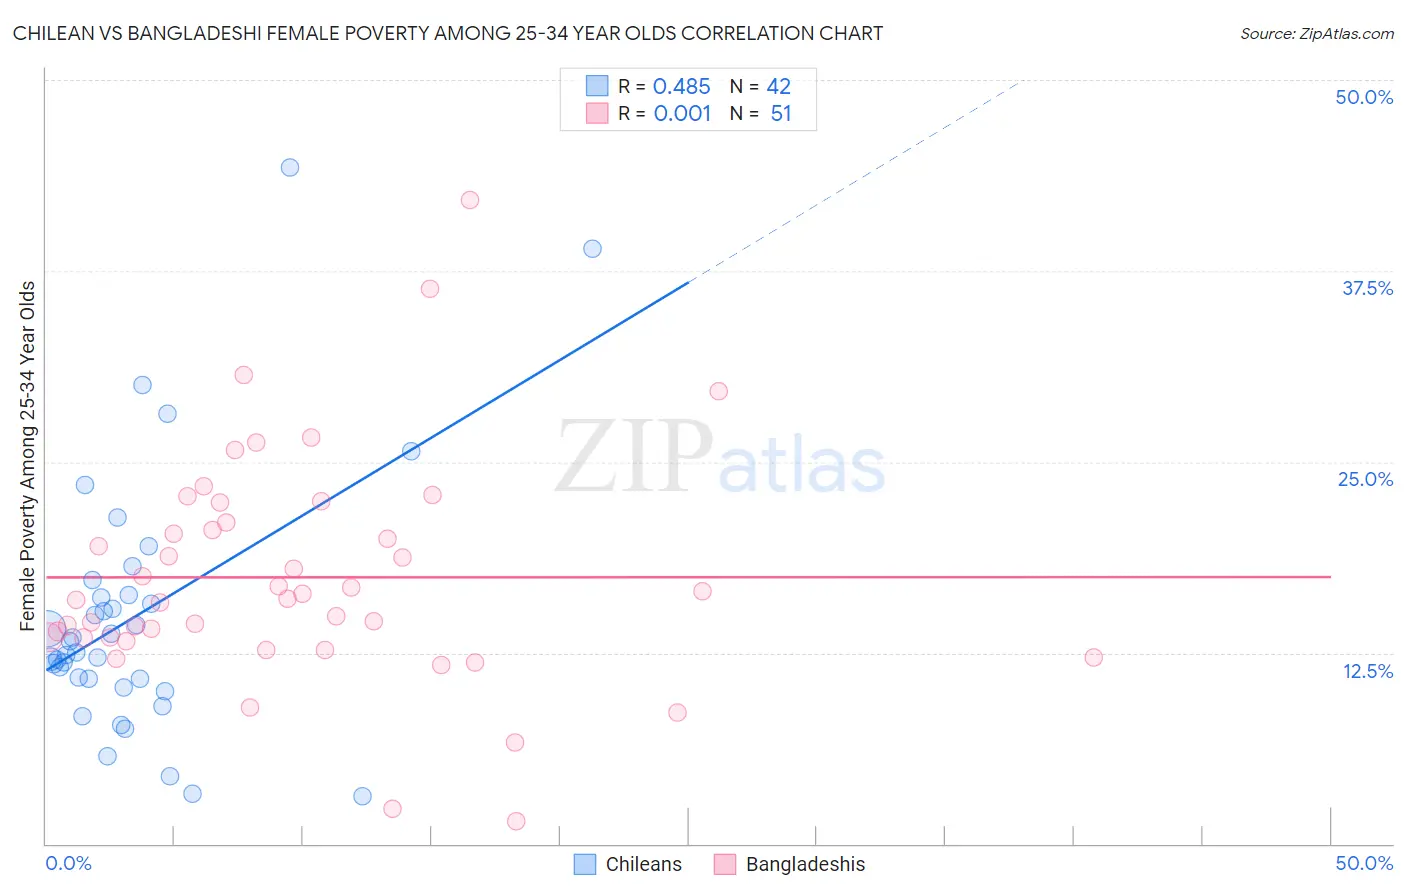
Chilean vs Bangladeshi Female Poverty Among 25-34 Year Olds Correlation Chart
The statistical analysis conducted on geographies consisting of 254,171,543 people shows a moderate positive correlation between the proportion of Chileans and poverty level among females between the ages 25 and 34 in the United States with a correlation coefficient (R) of 0.485 and weighted average of 12.8%. Similarly, the statistical analysis conducted on geographies consisting of 140,698,140 people shows no correlation between the proportion of Bangladeshis and poverty level among females between the ages 25 and 34 in the United States with a correlation coefficient (R) of 0.001 and weighted average of 15.9%, a difference of 24.3%.
Female Poverty Among 25-34 Year Olds Correlation Summary
| Measurement | Chilean | Bangladeshi |
| Minimum | 3.1% | 1.5% |
| Maximum | 44.3% | 42.1% |
| Range | 41.2% | 40.6% |
| Mean | 14.9% | 17.4% |
| Median | 12.9% | 16.1% |
| Interquartile 25% (IQ1) | 10.8% | 13.5% |
| Interquartile 75% (IQ3) | 16.3% | 21.0% |
| Interquartile Range (IQR) | 5.5% | 7.6% |
| Standard Deviation (Sample) | 8.5% | 7.5% |
| Standard Deviation (Population) | 8.4% | 7.4% |
Similar Demographics by Female Poverty Among 25-34 Year Olds
Demographics Similar to Chileans by Female Poverty Among 25-34 Year Olds
In terms of female poverty among 25-34 year olds, the demographic groups most similar to Chileans are Immigrants from Brazil (12.8%, a difference of 0.030%), Immigrants from Kuwait (12.8%, a difference of 0.060%), Mongolian (12.8%, a difference of 0.070%), Immigrants from Nepal (12.8%, a difference of 0.080%), and Carpatho Rusyn (12.8%, a difference of 0.090%).
| Demographics | Rating | Rank | Female Poverty Among 25-34 Year Olds |
| Immigrants | Peru | 94.3 /100 | #109 | Exceptional 12.7% |
| Australians | 94.1 /100 | #110 | Exceptional 12.8% |
| Danes | 93.9 /100 | #111 | Exceptional 12.8% |
| Immigrants | Morocco | 93.9 /100 | #112 | Exceptional 12.8% |
| Immigrants | Syria | 93.8 /100 | #113 | Exceptional 12.8% |
| Immigrants | Southern Europe | 93.6 /100 | #114 | Exceptional 12.8% |
| Immigrants | Brazil | 93.3 /100 | #115 | Exceptional 12.8% |
| Chileans | 93.2 /100 | #116 | Exceptional 12.8% |
| Immigrants | Kuwait | 93.1 /100 | #117 | Exceptional 12.8% |
| Mongolians | 93.0 /100 | #118 | Exceptional 12.8% |
| Immigrants | Nepal | 93.0 /100 | #119 | Exceptional 12.8% |
| Carpatho Rusyns | 93.0 /100 | #120 | Exceptional 12.8% |
| Romanians | 92.8 /100 | #121 | Exceptional 12.8% |
| Immigrants | Western Asia | 92.7 /100 | #122 | Exceptional 12.8% |
| Slovenes | 92.7 /100 | #123 | Exceptional 12.8% |
Demographics Similar to Bangladeshis by Female Poverty Among 25-34 Year Olds
In terms of female poverty among 25-34 year olds, the demographic groups most similar to Bangladeshis are French American Indian (15.9%, a difference of 0.16%), Fijian (15.9%, a difference of 0.16%), Immigrants from Micronesia (15.8%, a difference of 0.45%), Immigrants from Zaire (15.8%, a difference of 0.46%), and Immigrants from Latin America (16.0%, a difference of 0.51%).
| Demographics | Rating | Rank | Female Poverty Among 25-34 Year Olds |
| Immigrants | Nonimmigrants | 0.1 /100 | #273 | Tragic 15.6% |
| Immigrants | Caribbean | 0.0 /100 | #274 | Tragic 15.7% |
| Immigrants | Azores | 0.0 /100 | #275 | Tragic 15.8% |
| Immigrants | Zaire | 0.0 /100 | #276 | Tragic 15.8% |
| Immigrants | Micronesia | 0.0 /100 | #277 | Tragic 15.8% |
| French American Indians | 0.0 /100 | #278 | Tragic 15.9% |
| Fijians | 0.0 /100 | #279 | Tragic 15.9% |
| Bangladeshis | 0.0 /100 | #280 | Tragic 15.9% |
| Immigrants | Latin America | 0.0 /100 | #281 | Tragic 16.0% |
| Aleuts | 0.0 /100 | #282 | Tragic 16.1% |
| Bahamians | 0.0 /100 | #283 | Tragic 16.1% |
| Shoshone | 0.0 /100 | #284 | Tragic 16.2% |
| Immigrants | Bahamas | 0.0 /100 | #285 | Tragic 16.3% |
| Cape Verdeans | 0.0 /100 | #286 | Tragic 16.3% |
| Americans | 0.0 /100 | #287 | Tragic 16.4% |