Immigrants from Northern Africa vs Bangladeshi Female Poverty Among 25-34 Year Olds
COMPARE
Immigrants from Northern Africa
Bangladeshi
Female Poverty Among 25-34 Year Olds
Female Poverty Among 25-34 Year Olds Comparison
Immigrants from Northern Africa
Bangladeshis
12.6%
FEMALE POVERTY AMONG 25-34 YEAR OLDS
96.6/ 100
METRIC RATING
97th/ 347
METRIC RANK
15.9%
FEMALE POVERTY AMONG 25-34 YEAR OLDS
0.0/ 100
METRIC RATING
280th/ 347
METRIC RANK
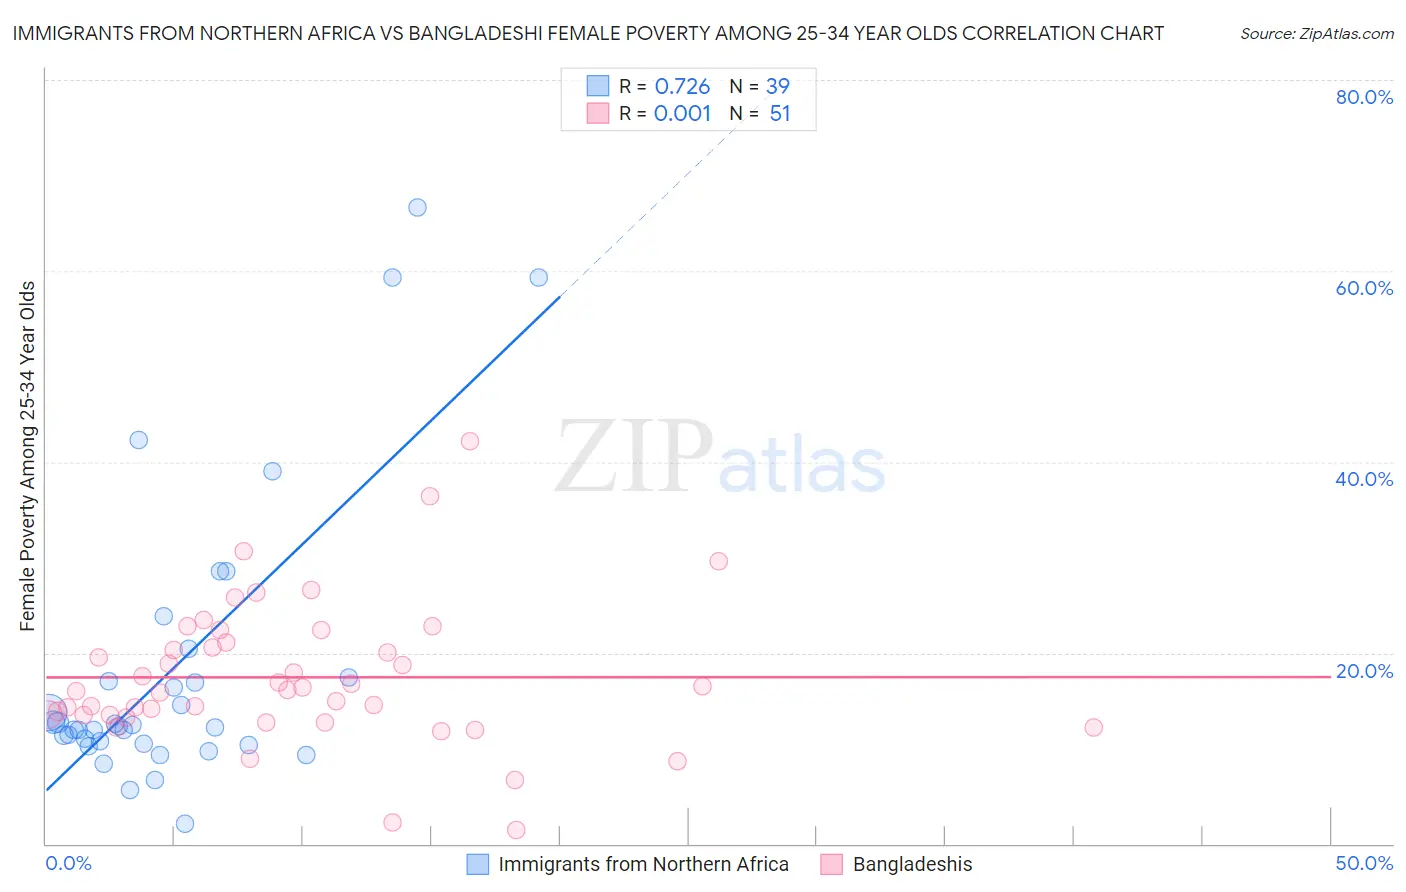
Immigrants from Northern Africa vs Bangladeshi Female Poverty Among 25-34 Year Olds Correlation Chart
The statistical analysis conducted on geographies consisting of 317,098,085 people shows a strong positive correlation between the proportion of Immigrants from Northern Africa and poverty level among females between the ages 25 and 34 in the United States with a correlation coefficient (R) of 0.726 and weighted average of 12.6%. Similarly, the statistical analysis conducted on geographies consisting of 140,698,140 people shows no correlation between the proportion of Bangladeshis and poverty level among females between the ages 25 and 34 in the United States with a correlation coefficient (R) of 0.001 and weighted average of 15.9%, a difference of 26.3%.
Female Poverty Among 25-34 Year Olds Correlation Summary
| Measurement | Immigrants from Northern Africa | Bangladeshi |
| Minimum | 2.0% | 1.5% |
| Maximum | 66.7% | 42.1% |
| Range | 64.6% | 40.6% |
| Mean | 18.3% | 17.4% |
| Median | 12.3% | 16.1% |
| Interquartile 25% (IQ1) | 10.4% | 13.5% |
| Interquartile 75% (IQ3) | 17.4% | 21.0% |
| Interquartile Range (IQR) | 7.0% | 7.6% |
| Standard Deviation (Sample) | 15.1% | 7.5% |
| Standard Deviation (Population) | 14.9% | 7.4% |
Similar Demographics by Female Poverty Among 25-34 Year Olds
Demographics Similar to Immigrants from Northern Africa by Female Poverty Among 25-34 Year Olds
In terms of female poverty among 25-34 year olds, the demographic groups most similar to Immigrants from Northern Africa are Immigrants from Ethiopia (12.6%, a difference of 0.0%), Immigrants from Argentina (12.6%, a difference of 0.11%), Immigrants from Zimbabwe (12.6%, a difference of 0.12%), Ukrainian (12.6%, a difference of 0.13%), and Immigrants from France (12.6%, a difference of 0.17%).
| Demographics | Rating | Rank | Female Poverty Among 25-34 Year Olds |
| Immigrants | Albania | 97.1 /100 | #90 | Exceptional 12.5% |
| Norwegians | 96.9 /100 | #91 | Exceptional 12.6% |
| Immigrants | Armenia | 96.9 /100 | #92 | Exceptional 12.6% |
| Palestinians | 96.9 /100 | #93 | Exceptional 12.6% |
| Immigrants | France | 96.8 /100 | #94 | Exceptional 12.6% |
| Ukrainians | 96.7 /100 | #95 | Exceptional 12.6% |
| Immigrants | Zimbabwe | 96.7 /100 | #96 | Exceptional 12.6% |
| Immigrants | Northern Africa | 96.6 /100 | #97 | Exceptional 12.6% |
| Immigrants | Ethiopia | 96.5 /100 | #98 | Exceptional 12.6% |
| Immigrants | Argentina | 96.4 /100 | #99 | Exceptional 12.6% |
| Immigrants | Denmark | 95.7 /100 | #100 | Exceptional 12.7% |
| Immigrants | Switzerland | 95.7 /100 | #101 | Exceptional 12.7% |
| Peruvians | 95.6 /100 | #102 | Exceptional 12.7% |
| Immigrants | Spain | 95.5 /100 | #103 | Exceptional 12.7% |
| Swedes | 95.4 /100 | #104 | Exceptional 12.7% |
Demographics Similar to Bangladeshis by Female Poverty Among 25-34 Year Olds
In terms of female poverty among 25-34 year olds, the demographic groups most similar to Bangladeshis are French American Indian (15.9%, a difference of 0.16%), Fijian (15.9%, a difference of 0.16%), Immigrants from Micronesia (15.8%, a difference of 0.45%), Immigrants from Zaire (15.8%, a difference of 0.46%), and Immigrants from Latin America (16.0%, a difference of 0.51%).
| Demographics | Rating | Rank | Female Poverty Among 25-34 Year Olds |
| Immigrants | Nonimmigrants | 0.1 /100 | #273 | Tragic 15.6% |
| Immigrants | Caribbean | 0.0 /100 | #274 | Tragic 15.7% |
| Immigrants | Azores | 0.0 /100 | #275 | Tragic 15.8% |
| Immigrants | Zaire | 0.0 /100 | #276 | Tragic 15.8% |
| Immigrants | Micronesia | 0.0 /100 | #277 | Tragic 15.8% |
| French American Indians | 0.0 /100 | #278 | Tragic 15.9% |
| Fijians | 0.0 /100 | #279 | Tragic 15.9% |
| Bangladeshis | 0.0 /100 | #280 | Tragic 15.9% |
| Immigrants | Latin America | 0.0 /100 | #281 | Tragic 16.0% |
| Aleuts | 0.0 /100 | #282 | Tragic 16.1% |
| Bahamians | 0.0 /100 | #283 | Tragic 16.1% |
| Shoshone | 0.0 /100 | #284 | Tragic 16.2% |
| Immigrants | Bahamas | 0.0 /100 | #285 | Tragic 16.3% |
| Cape Verdeans | 0.0 /100 | #286 | Tragic 16.3% |
| Americans | 0.0 /100 | #287 | Tragic 16.4% |