Cherokee vs Immigrants from Guyana Female Poverty Among 25-34 Year Olds
COMPARE
Cherokee
Immigrants from Guyana
Female Poverty Among 25-34 Year Olds
Female Poverty Among 25-34 Year Olds Comparison
Cherokee
Immigrants from Guyana
17.2%
FEMALE POVERTY AMONG 25-34 YEAR OLDS
0.0/ 100
METRIC RATING
310th/ 347
METRIC RANK
14.3%
FEMALE POVERTY AMONG 25-34 YEAR OLDS
6.6/ 100
METRIC RATING
212th/ 347
METRIC RANK
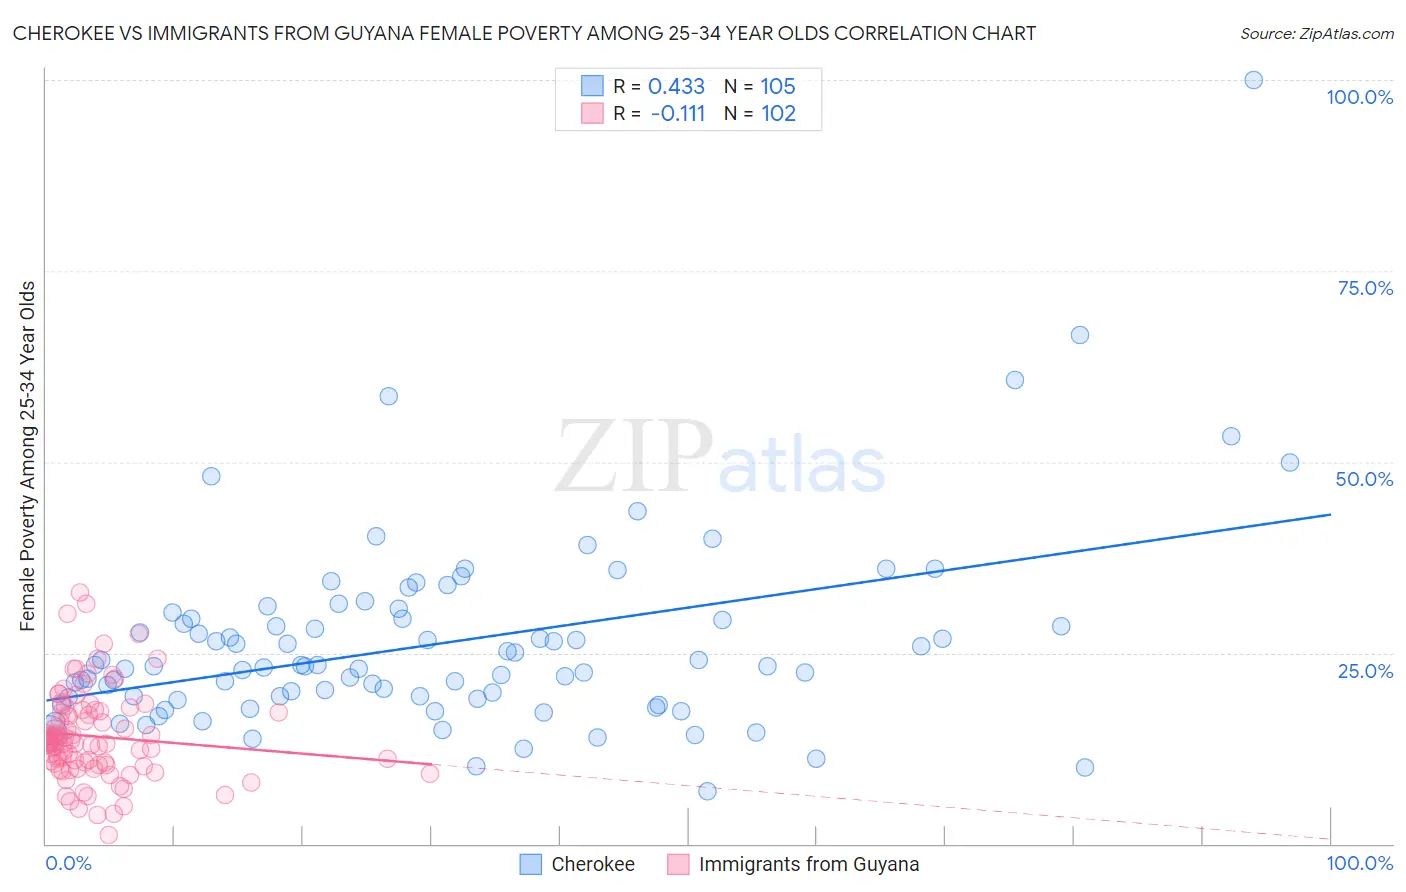
Cherokee vs Immigrants from Guyana Female Poverty Among 25-34 Year Olds Correlation Chart
The statistical analysis conducted on geographies consisting of 483,649,449 people shows a moderate positive correlation between the proportion of Cherokee and poverty level among females between the ages 25 and 34 in the United States with a correlation coefficient (R) of 0.433 and weighted average of 17.2%. Similarly, the statistical analysis conducted on geographies consisting of 181,727,129 people shows a poor negative correlation between the proportion of Immigrants from Guyana and poverty level among females between the ages 25 and 34 in the United States with a correlation coefficient (R) of -0.111 and weighted average of 14.3%, a difference of 20.3%.
Female Poverty Among 25-34 Year Olds Correlation Summary
| Measurement | Cherokee | Immigrants from Guyana |
| Minimum | 6.9% | 1.1% |
| Maximum | 100.0% | 32.9% |
| Range | 93.1% | 31.7% |
| Mean | 26.3% | 14.1% |
| Median | 23.3% | 13.3% |
| Interquartile 25% (IQ1) | 19.1% | 10.3% |
| Interquartile 75% (IQ3) | 29.5% | 17.2% |
| Interquartile Range (IQR) | 10.4% | 6.9% |
| Standard Deviation (Sample) | 12.8% | 5.9% |
| Standard Deviation (Population) | 12.7% | 5.9% |
Similar Demographics by Female Poverty Among 25-34 Year Olds
Demographics Similar to Cherokee by Female Poverty Among 25-34 Year Olds
In terms of female poverty among 25-34 year olds, the demographic groups most similar to Cherokee are Ottawa (17.1%, a difference of 0.47%), Immigrants from Honduras (17.3%, a difference of 0.48%), African (17.0%, a difference of 0.77%), Yaqui (17.0%, a difference of 0.98%), and Chickasaw (17.0%, a difference of 0.99%).
| Demographics | Rating | Rank | Female Poverty Among 25-34 Year Olds |
| Immigrants | Mexico | 0.0 /100 | #303 | Tragic 16.8% |
| Hondurans | 0.0 /100 | #304 | Tragic 16.9% |
| Immigrants | Cabo Verde | 0.0 /100 | #305 | Tragic 16.9% |
| Chickasaw | 0.0 /100 | #306 | Tragic 17.0% |
| Yaqui | 0.0 /100 | #307 | Tragic 17.0% |
| Africans | 0.0 /100 | #308 | Tragic 17.0% |
| Ottawa | 0.0 /100 | #309 | Tragic 17.1% |
| Cherokee | 0.0 /100 | #310 | Tragic 17.2% |
| Immigrants | Honduras | 0.0 /100 | #311 | Tragic 17.3% |
| Iroquois | 0.0 /100 | #312 | Tragic 17.5% |
| Colville | 0.0 /100 | #313 | Tragic 17.5% |
| Immigrants | Dominican Republic | 0.0 /100 | #314 | Tragic 17.6% |
| Yakama | 0.0 /100 | #315 | Tragic 17.6% |
| Dominicans | 0.0 /100 | #316 | Tragic 17.6% |
| Arapaho | 0.0 /100 | #317 | Tragic 17.8% |
Demographics Similar to Immigrants from Guyana by Female Poverty Among 25-34 Year Olds
In terms of female poverty among 25-34 year olds, the demographic groups most similar to Immigrants from Guyana are Puget Sound Salish (14.3%, a difference of 0.030%), French (14.3%, a difference of 0.13%), Immigrants from Nigeria (14.3%, a difference of 0.15%), French Canadian (14.3%, a difference of 0.40%), and Spanish American Indian (14.3%, a difference of 0.40%).
| Demographics | Rating | Rank | Female Poverty Among 25-34 Year Olds |
| Immigrants | Africa | 13.4 /100 | #205 | Poor 14.1% |
| Hungarians | 11.8 /100 | #206 | Poor 14.1% |
| Japanese | 11.7 /100 | #207 | Poor 14.1% |
| Immigrants | Panama | 11.6 /100 | #208 | Poor 14.1% |
| Guyanese | 8.6 /100 | #209 | Tragic 14.2% |
| Panamanians | 8.6 /100 | #210 | Tragic 14.2% |
| Trinidadians and Tobagonians | 8.2 /100 | #211 | Tragic 14.2% |
| Immigrants | Guyana | 6.6 /100 | #212 | Tragic 14.3% |
| Puget Sound Salish | 6.5 /100 | #213 | Tragic 14.3% |
| French | 6.2 /100 | #214 | Tragic 14.3% |
| Immigrants | Nigeria | 6.2 /100 | #215 | Tragic 14.3% |
| French Canadians | 5.5 /100 | #216 | Tragic 14.3% |
| Spanish American Indians | 5.5 /100 | #217 | Tragic 14.3% |
| Immigrants | Thailand | 5.2 /100 | #218 | Tragic 14.3% |
| Ecuadorians | 5.2 /100 | #219 | Tragic 14.3% |