Canadian vs Immigrants from Spain Seniors Poverty Over the Age of 75
COMPARE
Canadian
Immigrants from Spain
Seniors Poverty Over the Age of 75
Seniors Poverty Over the Age of 75 Comparison
Canadians
Immigrants from Spain
11.3%
SENIORS POVERTY OVER THE AGE OF 75
97.7/ 100
METRIC RATING
61st/ 347
METRIC RANK
13.7%
SENIORS POVERTY OVER THE AGE OF 75
0.2/ 100
METRIC RATING
253rd/ 347
METRIC RANK
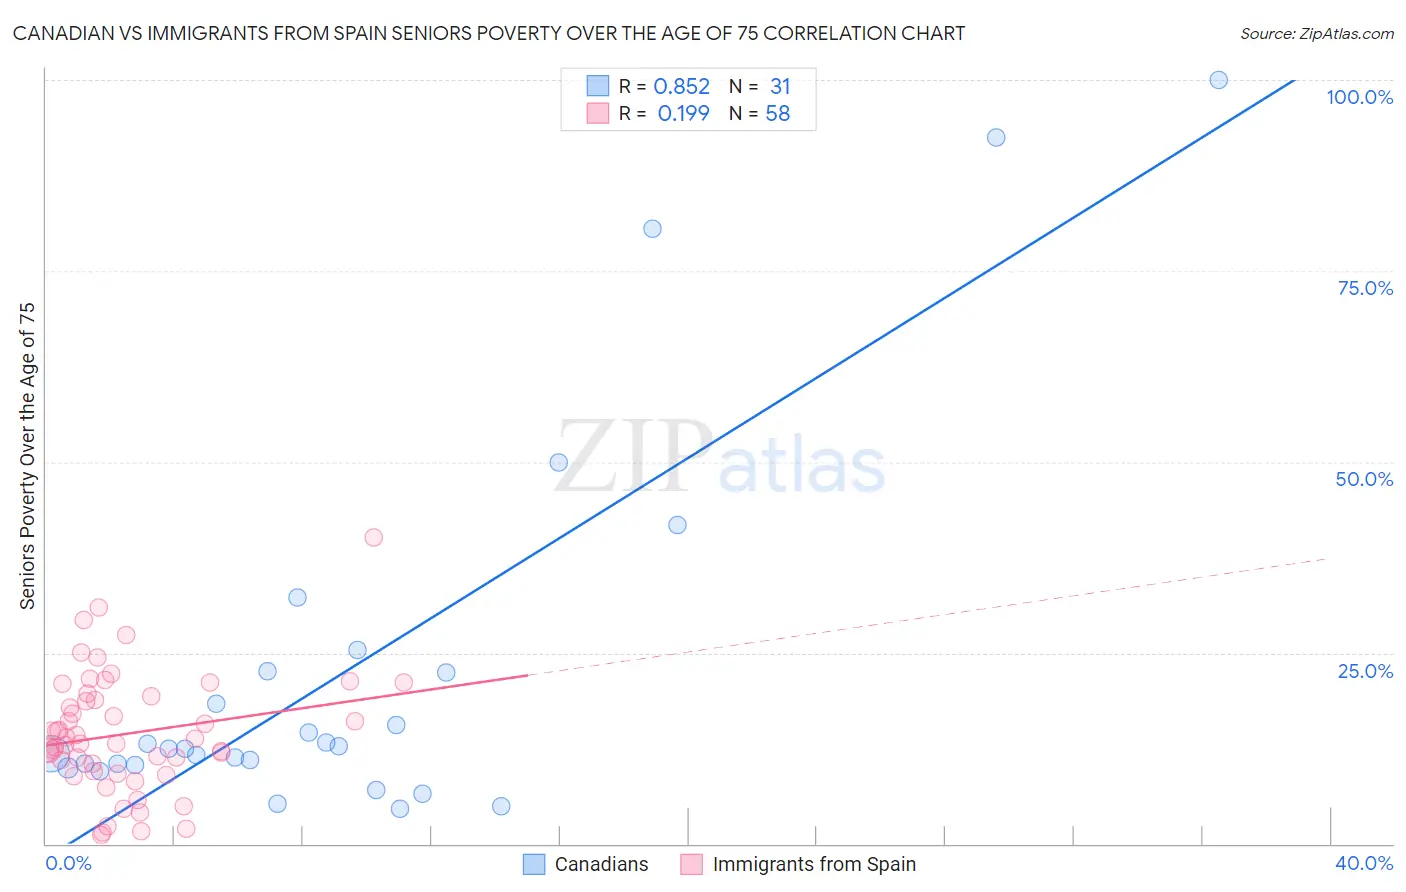
Canadian vs Immigrants from Spain Seniors Poverty Over the Age of 75 Correlation Chart
The statistical analysis conducted on geographies consisting of 430,823,365 people shows a very strong positive correlation between the proportion of Canadians and poverty level among seniors over the age of 75 in the United States with a correlation coefficient (R) of 0.852 and weighted average of 11.3%. Similarly, the statistical analysis conducted on geographies consisting of 238,304,495 people shows a poor positive correlation between the proportion of Immigrants from Spain and poverty level among seniors over the age of 75 in the United States with a correlation coefficient (R) of 0.199 and weighted average of 13.7%, a difference of 21.6%.
Seniors Poverty Over the Age of 75 Correlation Summary
| Measurement | Canadian | Immigrants from Spain |
| Minimum | 4.7% | 1.1% |
| Maximum | 100.0% | 40.1% |
| Range | 95.3% | 39.0% |
| Mean | 22.7% | 14.4% |
| Median | 12.5% | 13.5% |
| Interquartile 25% (IQ1) | 10.3% | 9.4% |
| Interquartile 75% (IQ3) | 22.6% | 19.3% |
| Interquartile Range (IQR) | 12.3% | 9.8% |
| Standard Deviation (Sample) | 25.0% | 7.8% |
| Standard Deviation (Population) | 24.6% | 7.7% |
Similar Demographics by Seniors Poverty Over the Age of 75
Demographics Similar to Canadians by Seniors Poverty Over the Age of 75
In terms of seniors poverty over the age of 75, the demographic groups most similar to Canadians are Eastern European (11.3%, a difference of 0.030%), Immigrants from North America (11.3%, a difference of 0.10%), Immigrants from Afghanistan (11.3%, a difference of 0.14%), Immigrants from Netherlands (11.2%, a difference of 0.15%), and Yugoslavian (11.2%, a difference of 0.23%).
| Demographics | Rating | Rank | Seniors Poverty Over the Age of 75 |
| Afghans | 98.2 /100 | #54 | Exceptional 11.2% |
| Hungarians | 98.1 /100 | #55 | Exceptional 11.2% |
| Slavs | 98.1 /100 | #56 | Exceptional 11.2% |
| Immigrants | Canada | 97.9 /100 | #57 | Exceptional 11.2% |
| Yugoslavians | 97.9 /100 | #58 | Exceptional 11.2% |
| Immigrants | Netherlands | 97.8 /100 | #59 | Exceptional 11.2% |
| Eastern Europeans | 97.7 /100 | #60 | Exceptional 11.3% |
| Canadians | 97.7 /100 | #61 | Exceptional 11.3% |
| Immigrants | North America | 97.6 /100 | #62 | Exceptional 11.3% |
| Immigrants | Afghanistan | 97.5 /100 | #63 | Exceptional 11.3% |
| Immigrants | Northern Europe | 97.4 /100 | #64 | Exceptional 11.3% |
| Immigrants | Taiwan | 96.7 /100 | #65 | Exceptional 11.4% |
| Estonians | 96.7 /100 | #66 | Exceptional 11.4% |
| Bolivians | 96.5 /100 | #67 | Exceptional 11.4% |
| Immigrants | Austria | 96.5 /100 | #68 | Exceptional 11.4% |
Demographics Similar to Immigrants from Spain by Seniors Poverty Over the Age of 75
In terms of seniors poverty over the age of 75, the demographic groups most similar to Immigrants from Spain are Blackfeet (13.7%, a difference of 0.11%), Immigrants from Argentina (13.7%, a difference of 0.22%), Immigrants from Peru (13.7%, a difference of 0.27%), Immigrants from Belarus (13.8%, a difference of 0.54%), and Mexican American Indian (13.6%, a difference of 0.60%).
| Demographics | Rating | Rank | Seniors Poverty Over the Age of 75 |
| Immigrants | Cambodia | 0.4 /100 | #246 | Tragic 13.6% |
| Immigrants | Ukraine | 0.3 /100 | #247 | Tragic 13.6% |
| Africans | 0.3 /100 | #248 | Tragic 13.6% |
| Immigrants | Albania | 0.3 /100 | #249 | Tragic 13.6% |
| Mexican American Indians | 0.3 /100 | #250 | Tragic 13.6% |
| Immigrants | Peru | 0.3 /100 | #251 | Tragic 13.7% |
| Immigrants | Argentina | 0.3 /100 | #252 | Tragic 13.7% |
| Immigrants | Spain | 0.2 /100 | #253 | Tragic 13.7% |
| Blackfeet | 0.2 /100 | #254 | Tragic 13.7% |
| Immigrants | Belarus | 0.2 /100 | #255 | Tragic 13.8% |
| Inupiat | 0.1 /100 | #256 | Tragic 13.8% |
| Immigrants | Western Africa | 0.1 /100 | #257 | Tragic 13.9% |
| Immigrants | Panama | 0.1 /100 | #258 | Tragic 13.9% |
| Immigrants | Portugal | 0.1 /100 | #259 | Tragic 13.9% |
| Immigrants | Immigrants | 0.1 /100 | #260 | Tragic 13.9% |