Immigrants from Sri Lanka vs Immigrants from Spain Seniors Poverty Over the Age of 75
COMPARE
Immigrants from Sri Lanka
Immigrants from Spain
Seniors Poverty Over the Age of 75
Seniors Poverty Over the Age of 75 Comparison
Immigrants from Sri Lanka
Immigrants from Spain
11.5%
SENIORS POVERTY OVER THE AGE OF 75
94.4/ 100
METRIC RATING
89th/ 347
METRIC RANK
13.7%
SENIORS POVERTY OVER THE AGE OF 75
0.2/ 100
METRIC RATING
253rd/ 347
METRIC RANK
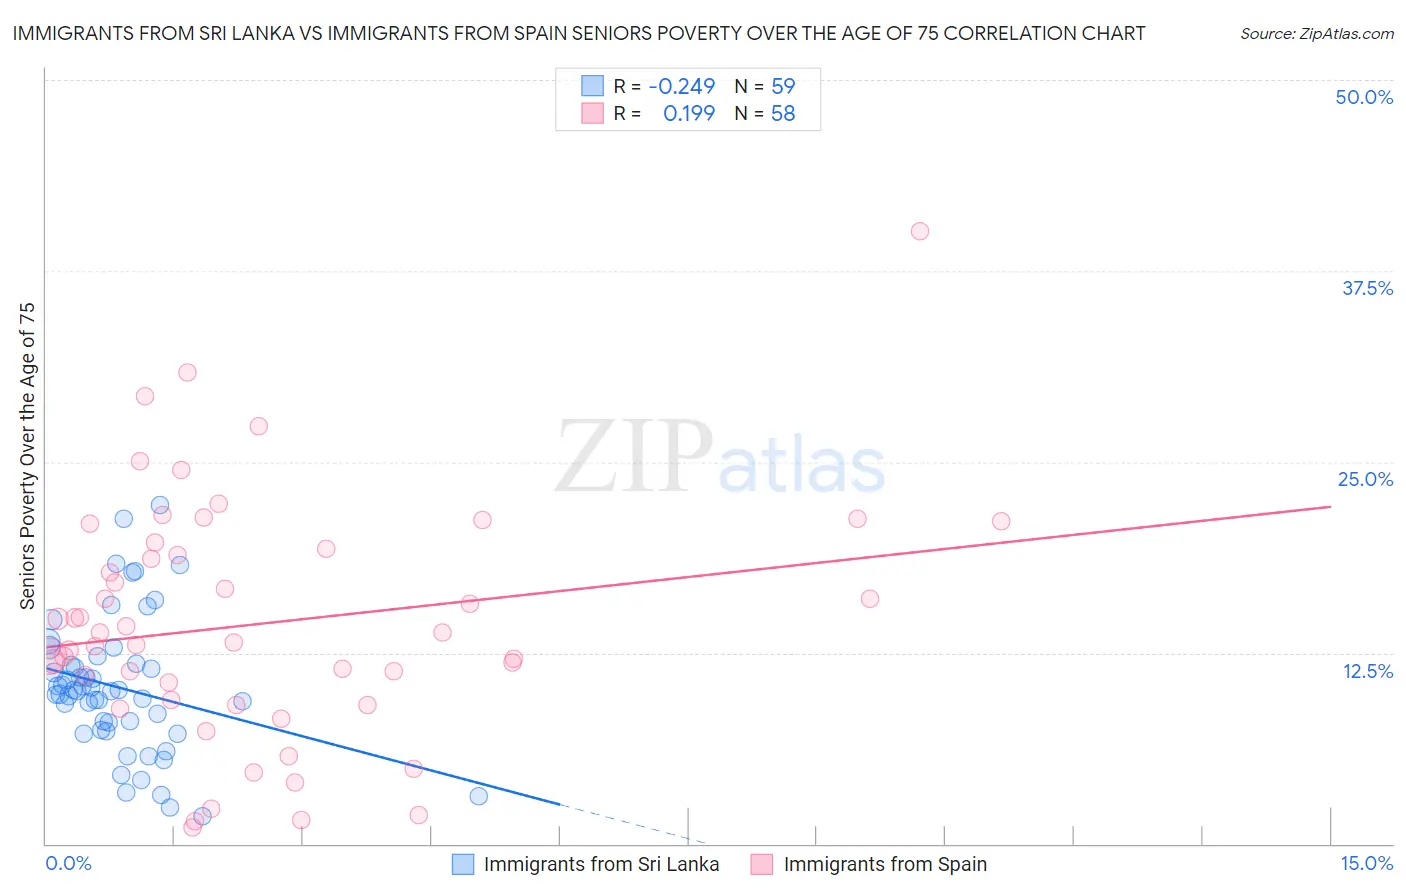
Immigrants from Sri Lanka vs Immigrants from Spain Seniors Poverty Over the Age of 75 Correlation Chart
The statistical analysis conducted on geographies consisting of 149,120,503 people shows a weak negative correlation between the proportion of Immigrants from Sri Lanka and poverty level among seniors over the age of 75 in the United States with a correlation coefficient (R) of -0.249 and weighted average of 11.5%. Similarly, the statistical analysis conducted on geographies consisting of 238,304,495 people shows a poor positive correlation between the proportion of Immigrants from Spain and poverty level among seniors over the age of 75 in the United States with a correlation coefficient (R) of 0.199 and weighted average of 13.7%, a difference of 19.2%.
Seniors Poverty Over the Age of 75 Correlation Summary
| Measurement | Immigrants from Sri Lanka | Immigrants from Spain |
| Minimum | 1.8% | 1.1% |
| Maximum | 22.2% | 40.1% |
| Range | 20.4% | 39.0% |
| Mean | 10.2% | 14.4% |
| Median | 10.0% | 13.5% |
| Interquartile 25% (IQ1) | 7.4% | 9.4% |
| Interquartile 75% (IQ3) | 11.7% | 19.3% |
| Interquartile Range (IQR) | 4.3% | 9.8% |
| Standard Deviation (Sample) | 4.4% | 7.8% |
| Standard Deviation (Population) | 4.4% | 7.7% |
Similar Demographics by Seniors Poverty Over the Age of 75
Demographics Similar to Immigrants from Sri Lanka by Seniors Poverty Over the Age of 75
In terms of seniors poverty over the age of 75, the demographic groups most similar to Immigrants from Sri Lanka are Immigrants from Croatia (11.5%, a difference of 0.030%), Korean (11.5%, a difference of 0.050%), Australian (11.5%, a difference of 0.080%), Immigrants from Bulgaria (11.5%, a difference of 0.10%), and Aleut (11.5%, a difference of 0.11%).
| Demographics | Rating | Rank | Seniors Poverty Over the Age of 75 |
| Iranians | 95.1 /100 | #82 | Exceptional 11.5% |
| Immigrants | South Africa | 94.9 /100 | #83 | Exceptional 11.5% |
| Immigrants | Iraq | 94.9 /100 | #84 | Exceptional 11.5% |
| Immigrants | Bulgaria | 94.7 /100 | #85 | Exceptional 11.5% |
| Australians | 94.6 /100 | #86 | Exceptional 11.5% |
| Koreans | 94.5 /100 | #87 | Exceptional 11.5% |
| Immigrants | Croatia | 94.5 /100 | #88 | Exceptional 11.5% |
| Immigrants | Sri Lanka | 94.4 /100 | #89 | Exceptional 11.5% |
| Aleuts | 94.1 /100 | #90 | Exceptional 11.5% |
| Immigrants | Germany | 94.1 /100 | #91 | Exceptional 11.5% |
| Kenyans | 93.9 /100 | #92 | Exceptional 11.5% |
| Immigrants | Poland | 92.9 /100 | #93 | Exceptional 11.6% |
| Creek | 92.7 /100 | #94 | Exceptional 11.6% |
| Immigrants | Bosnia and Herzegovina | 92.6 /100 | #95 | Exceptional 11.6% |
| Immigrants | Sweden | 92.6 /100 | #96 | Exceptional 11.6% |
Demographics Similar to Immigrants from Spain by Seniors Poverty Over the Age of 75
In terms of seniors poverty over the age of 75, the demographic groups most similar to Immigrants from Spain are Blackfeet (13.7%, a difference of 0.11%), Immigrants from Argentina (13.7%, a difference of 0.22%), Immigrants from Peru (13.7%, a difference of 0.27%), Immigrants from Belarus (13.8%, a difference of 0.54%), and Mexican American Indian (13.6%, a difference of 0.60%).
| Demographics | Rating | Rank | Seniors Poverty Over the Age of 75 |
| Immigrants | Cambodia | 0.4 /100 | #246 | Tragic 13.6% |
| Immigrants | Ukraine | 0.3 /100 | #247 | Tragic 13.6% |
| Africans | 0.3 /100 | #248 | Tragic 13.6% |
| Immigrants | Albania | 0.3 /100 | #249 | Tragic 13.6% |
| Mexican American Indians | 0.3 /100 | #250 | Tragic 13.6% |
| Immigrants | Peru | 0.3 /100 | #251 | Tragic 13.7% |
| Immigrants | Argentina | 0.3 /100 | #252 | Tragic 13.7% |
| Immigrants | Spain | 0.2 /100 | #253 | Tragic 13.7% |
| Blackfeet | 0.2 /100 | #254 | Tragic 13.7% |
| Immigrants | Belarus | 0.2 /100 | #255 | Tragic 13.8% |
| Inupiat | 0.1 /100 | #256 | Tragic 13.8% |
| Immigrants | Western Africa | 0.1 /100 | #257 | Tragic 13.9% |
| Immigrants | Panama | 0.1 /100 | #258 | Tragic 13.9% |
| Immigrants | Portugal | 0.1 /100 | #259 | Tragic 13.9% |
| Immigrants | Immigrants | 0.1 /100 | #260 | Tragic 13.9% |