Cambodian vs Immigrants from Costa Rica Child Poverty Under the Age of 16
COMPARE
Cambodian
Immigrants from Costa Rica
Child Poverty Under the Age of 16
Child Poverty Under the Age of 16 Comparison
Cambodians
Immigrants from Costa Rica
14.4%
CHILD POVERTY UNDER THE AGE OF 16
97.8/ 100
METRIC RATING
72nd/ 347
METRIC RANK
16.6%
CHILD POVERTY UNDER THE AGE OF 16
29.6/ 100
METRIC RATING
190th/ 347
METRIC RANK
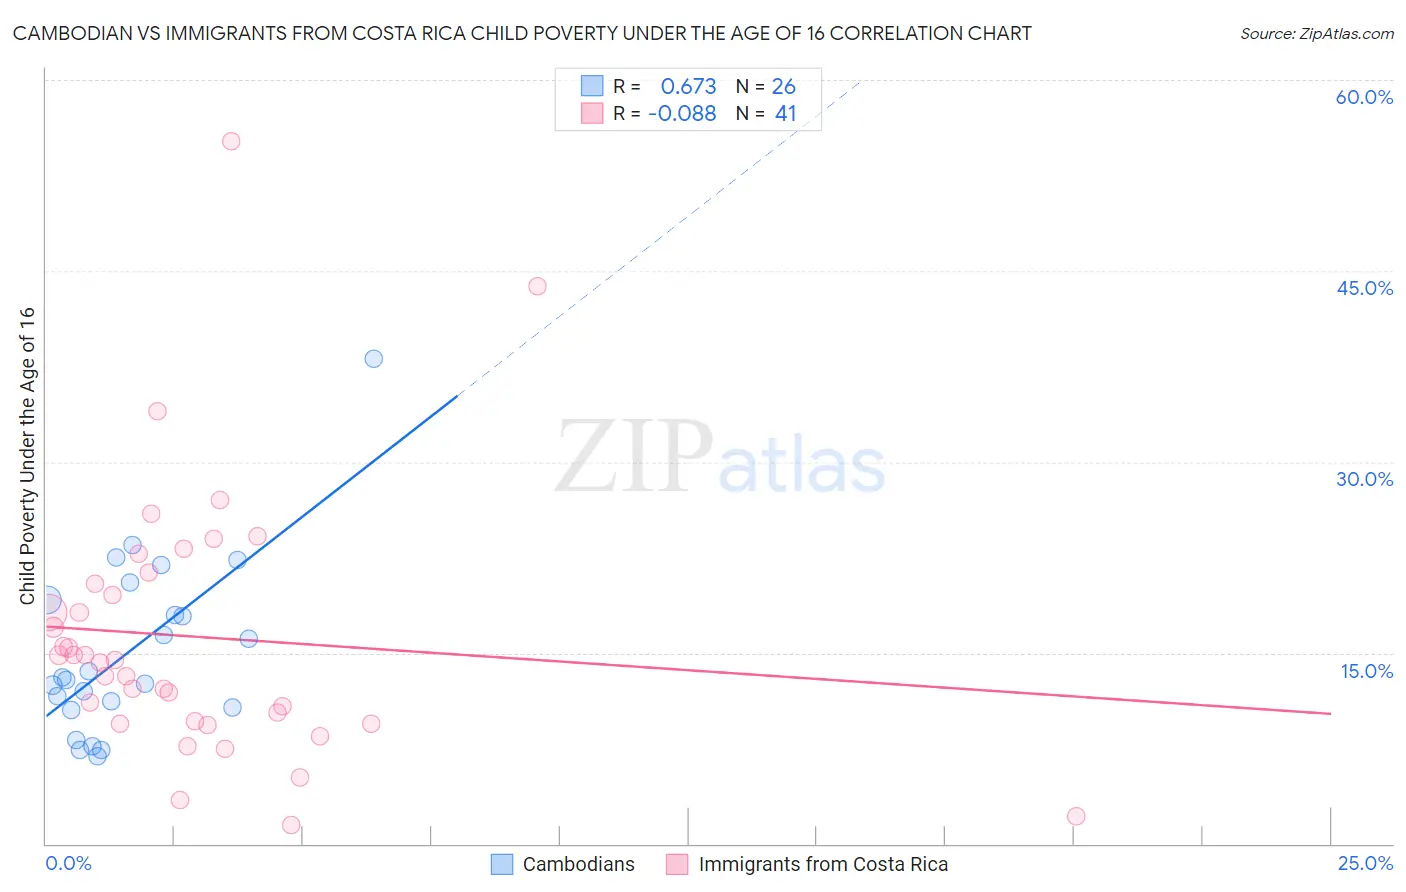
Cambodian vs Immigrants from Costa Rica Child Poverty Under the Age of 16 Correlation Chart
The statistical analysis conducted on geographies consisting of 102,284,203 people shows a significant positive correlation between the proportion of Cambodians and poverty level among children under the age of 16 in the United States with a correlation coefficient (R) of 0.673 and weighted average of 14.4%. Similarly, the statistical analysis conducted on geographies consisting of 203,534,794 people shows a slight negative correlation between the proportion of Immigrants from Costa Rica and poverty level among children under the age of 16 in the United States with a correlation coefficient (R) of -0.088 and weighted average of 16.6%, a difference of 15.7%.
Child Poverty Under the Age of 16 Correlation Summary
| Measurement | Cambodian | Immigrants from Costa Rica |
| Minimum | 6.8% | 1.5% |
| Maximum | 38.1% | 55.2% |
| Range | 31.2% | 53.7% |
| Mean | 15.2% | 16.3% |
| Median | 13.0% | 14.4% |
| Interquartile 25% (IQ1) | 10.7% | 9.5% |
| Interquartile 75% (IQ3) | 19.2% | 20.9% |
| Interquartile Range (IQR) | 8.4% | 11.4% |
| Standard Deviation (Sample) | 7.0% | 10.4% |
| Standard Deviation (Population) | 6.8% | 10.3% |
Similar Demographics by Child Poverty Under the Age of 16
Demographics Similar to Cambodians by Child Poverty Under the Age of 16
In terms of child poverty under the age of 16, the demographic groups most similar to Cambodians are Immigrants from Turkey (14.4%, a difference of 0.21%), Macedonian (14.4%, a difference of 0.21%), Immigrants from Poland (14.3%, a difference of 0.22%), Immigrants from Netherlands (14.3%, a difference of 0.23%), and Immigrants from Bulgaria (14.3%, a difference of 0.33%).
| Demographics | Rating | Rank | Child Poverty Under the Age of 16 |
| Immigrants | Philippines | 98.2 /100 | #65 | Exceptional 14.3% |
| Slovenes | 98.1 /100 | #66 | Exceptional 14.3% |
| Europeans | 98.1 /100 | #67 | Exceptional 14.3% |
| Laotians | 98.0 /100 | #68 | Exceptional 14.3% |
| Immigrants | Bulgaria | 98.0 /100 | #69 | Exceptional 14.3% |
| Immigrants | Netherlands | 97.9 /100 | #70 | Exceptional 14.3% |
| Immigrants | Poland | 97.9 /100 | #71 | Exceptional 14.3% |
| Cambodians | 97.8 /100 | #72 | Exceptional 14.4% |
| Immigrants | Turkey | 97.6 /100 | #73 | Exceptional 14.4% |
| Macedonians | 97.6 /100 | #74 | Exceptional 14.4% |
| Ukrainians | 97.5 /100 | #75 | Exceptional 14.4% |
| Immigrants | Eastern Europe | 97.5 /100 | #76 | Exceptional 14.4% |
| Australians | 97.5 /100 | #77 | Exceptional 14.4% |
| Immigrants | Russia | 97.3 /100 | #78 | Exceptional 14.5% |
| Swiss | 97.3 /100 | #79 | Exceptional 14.5% |
Demographics Similar to Immigrants from Costa Rica by Child Poverty Under the Age of 16
In terms of child poverty under the age of 16, the demographic groups most similar to Immigrants from Costa Rica are Immigrants from Portugal (16.6%, a difference of 0.060%), Immigrants from Iraq (16.7%, a difference of 0.19%), Immigrants from Morocco (16.6%, a difference of 0.22%), Arab (16.6%, a difference of 0.24%), and Kenyan (16.5%, a difference of 0.61%).
| Demographics | Rating | Rank | Child Poverty Under the Age of 16 |
| Celtics | 38.2 /100 | #183 | Fair 16.4% |
| Immigrants | Western Asia | 38.0 /100 | #184 | Fair 16.4% |
| Immigrants | Bosnia and Herzegovina | 37.4 /100 | #185 | Fair 16.5% |
| Kenyans | 34.1 /100 | #186 | Fair 16.5% |
| Arabs | 31.4 /100 | #187 | Fair 16.6% |
| Immigrants | Morocco | 31.2 /100 | #188 | Fair 16.6% |
| Immigrants | Portugal | 30.0 /100 | #189 | Fair 16.6% |
| Immigrants | Costa Rica | 29.6 /100 | #190 | Fair 16.6% |
| Immigrants | Iraq | 28.3 /100 | #191 | Fair 16.7% |
| Spanish | 24.5 /100 | #192 | Fair 16.7% |
| Spaniards | 23.2 /100 | #193 | Fair 16.8% |
| Immigrants | Uruguay | 23.1 /100 | #194 | Fair 16.8% |
| Immigrants | Uganda | 22.5 /100 | #195 | Fair 16.8% |
| Immigrants | Lebanon | 22.0 /100 | #196 | Fair 16.8% |
| Immigrants | Kenya | 19.1 /100 | #197 | Poor 16.9% |