Bulgarian vs Nonimmigrants Receiving Food Stamps
COMPARE
Bulgarian
Nonimmigrants
Receiving Food Stamps
Receiving Food Stamps Comparison
Bulgarians
Nonimmigrants
8.9%
RECEIVING FOOD STAMPS
99.9/ 100
METRIC RATING
13th/ 347
METRIC RANK
12.4%
RECEIVING FOOD STAMPS
17.6/ 100
METRIC RATING
204th/ 347
METRIC RANK
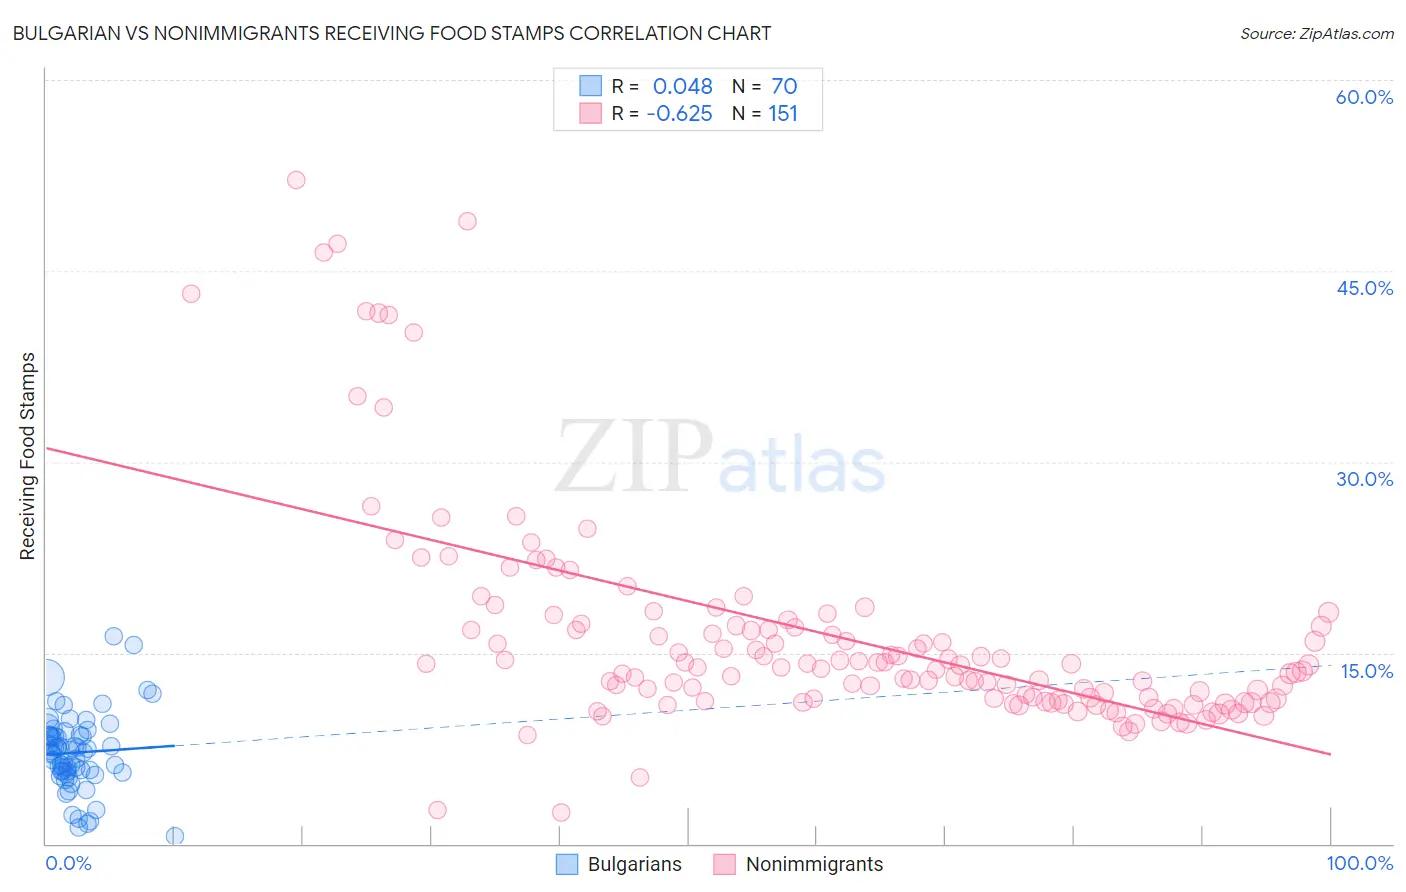
Bulgarian vs Nonimmigrants Receiving Food Stamps Correlation Chart
The statistical analysis conducted on geographies consisting of 205,325,342 people shows no correlation between the proportion of Bulgarians and percentage of population receiving government assistance and/or food stamps in the United States with a correlation coefficient (R) of 0.048 and weighted average of 8.9%. Similarly, the statistical analysis conducted on geographies consisting of 580,622,931 people shows a significant negative correlation between the proportion of Nonimmigrants and percentage of population receiving government assistance and/or food stamps in the United States with a correlation coefficient (R) of -0.625 and weighted average of 12.4%, a difference of 39.2%.
Receiving Food Stamps Correlation Summary
| Measurement | Bulgarian | Nonimmigrants |
| Minimum | 0.60% | 2.4% |
| Maximum | 16.3% | 52.1% |
| Range | 15.7% | 49.7% |
| Mean | 7.2% | 16.2% |
| Median | 7.2% | 13.8% |
| Interquartile 25% (IQ1) | 5.7% | 11.2% |
| Interquartile 75% (IQ3) | 8.5% | 17.1% |
| Interquartile Range (IQR) | 2.8% | 5.9% |
| Standard Deviation (Sample) | 3.0% | 8.7% |
| Standard Deviation (Population) | 3.0% | 8.6% |
Similar Demographics by Receiving Food Stamps
Demographics Similar to Bulgarians by Receiving Food Stamps
In terms of receiving food stamps, the demographic groups most similar to Bulgarians are Maltese (8.9%, a difference of 0.13%), Cypriot (8.9%, a difference of 0.19%), Okinawan (8.9%, a difference of 0.20%), Immigrants from South Central Asia (8.8%, a difference of 0.63%), and Norwegian (9.0%, a difference of 0.79%).
| Demographics | Rating | Rank | Receiving Food Stamps |
| Immigrants | Singapore | 100.0 /100 | #6 | Exceptional 8.3% |
| Immigrants | Iran | 100.0 /100 | #7 | Exceptional 8.3% |
| Burmese | 99.9 /100 | #8 | Exceptional 8.6% |
| Immigrants | Korea | 99.9 /100 | #9 | Exceptional 8.7% |
| Immigrants | South Central Asia | 99.9 /100 | #10 | Exceptional 8.8% |
| Okinawans | 99.9 /100 | #11 | Exceptional 8.9% |
| Cypriots | 99.9 /100 | #12 | Exceptional 8.9% |
| Bulgarians | 99.9 /100 | #13 | Exceptional 8.9% |
| Maltese | 99.9 /100 | #14 | Exceptional 8.9% |
| Norwegians | 99.9 /100 | #15 | Exceptional 9.0% |
| Immigrants | Japan | 99.9 /100 | #16 | Exceptional 9.0% |
| Immigrants | Scotland | 99.9 /100 | #17 | Exceptional 9.0% |
| Danes | 99.9 /100 | #18 | Exceptional 9.0% |
| Immigrants | Hong Kong | 99.8 /100 | #19 | Exceptional 9.1% |
| Latvians | 99.8 /100 | #20 | Exceptional 9.1% |
Demographics Similar to Nonimmigrants by Receiving Food Stamps
In terms of receiving food stamps, the demographic groups most similar to Nonimmigrants are Shoshone (12.4%, a difference of 0.030%), Aleut (12.4%, a difference of 0.070%), Immigrants from Thailand (12.4%, a difference of 0.13%), South American (12.4%, a difference of 0.39%), and Immigrants from Venezuela (12.3%, a difference of 0.56%).
| Demographics | Rating | Rank | Receiving Food Stamps |
| Delaware | 26.1 /100 | #197 | Fair 12.2% |
| Immigrants | Costa Rica | 25.4 /100 | #198 | Fair 12.2% |
| Portuguese | 25.1 /100 | #199 | Fair 12.2% |
| Sierra Leoneans | 23.6 /100 | #200 | Fair 12.2% |
| Ugandans | 22.5 /100 | #201 | Fair 12.2% |
| Immigrants | Venezuela | 20.1 /100 | #202 | Fair 12.3% |
| Shoshone | 17.7 /100 | #203 | Poor 12.4% |
| Immigrants | Nonimmigrants | 17.6 /100 | #204 | Poor 12.4% |
| Aleuts | 17.3 /100 | #205 | Poor 12.4% |
| Immigrants | Thailand | 17.0 /100 | #206 | Poor 12.4% |
| South Americans | 16.0 /100 | #207 | Poor 12.4% |
| Potawatomi | 14.6 /100 | #208 | Poor 12.5% |
| Immigrants | Sierra Leone | 12.9 /100 | #209 | Poor 12.5% |
| Immigrants | Uruguay | 12.8 /100 | #210 | Poor 12.5% |
| Colombians | 10.2 /100 | #211 | Poor 12.6% |