British West Indian vs Fijian Single Female Poverty
COMPARE
British West Indian
Fijian
Single Female Poverty
Single Female Poverty Comparison
British West Indians
Fijians
22.8%
SINGLE FEMALE POVERTY
0.4/ 100
METRIC RATING
262nd/ 347
METRIC RANK
23.1%
SINGLE FEMALE POVERTY
0.2/ 100
METRIC RATING
268th/ 347
METRIC RANK
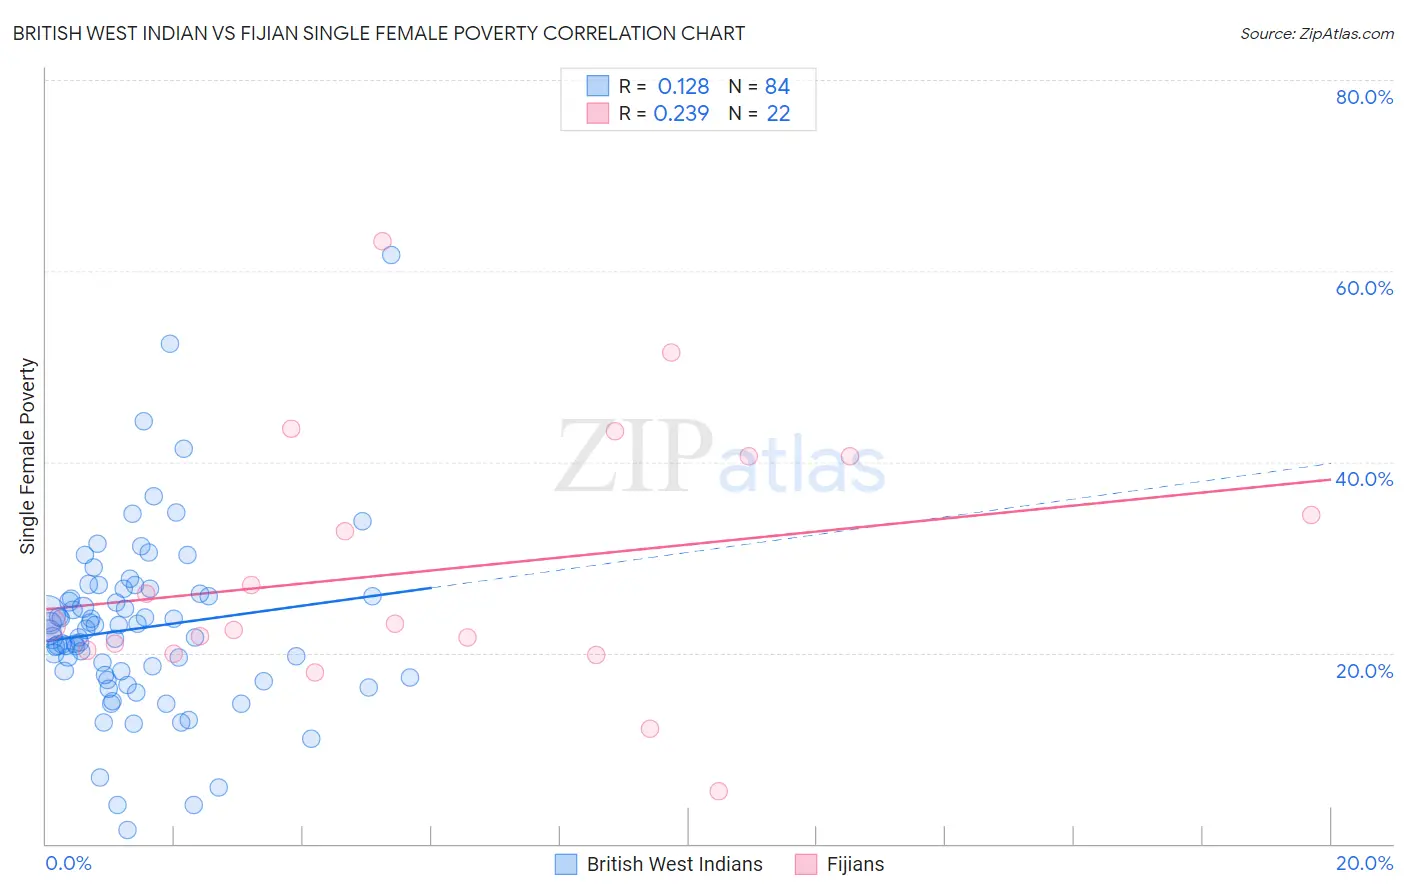
British West Indian vs Fijian Single Female Poverty Correlation Chart
The statistical analysis conducted on geographies consisting of 151,955,879 people shows a poor positive correlation between the proportion of British West Indians and poverty level among single females in the United States with a correlation coefficient (R) of 0.128 and weighted average of 22.8%. Similarly, the statistical analysis conducted on geographies consisting of 55,892,814 people shows a weak positive correlation between the proportion of Fijians and poverty level among single females in the United States with a correlation coefficient (R) of 0.239 and weighted average of 23.1%, a difference of 0.99%.
Single Female Poverty Correlation Summary
| Measurement | British West Indian | Fijian |
| Minimum | 1.4% | 5.6% |
| Maximum | 61.7% | 63.2% |
| Range | 60.3% | 57.6% |
| Mean | 22.6% | 28.7% |
| Median | 21.9% | 23.0% |
| Interquartile 25% (IQ1) | 17.6% | 20.3% |
| Interquartile 75% (IQ3) | 26.0% | 40.6% |
| Interquartile Range (IQR) | 8.5% | 20.3% |
| Standard Deviation (Sample) | 9.4% | 13.6% |
| Standard Deviation (Population) | 9.3% | 13.3% |
Demographics Similar to British West Indians and Fijians by Single Female Poverty
In terms of single female poverty, the demographic groups most similar to British West Indians are Immigrants from Cabo Verde (22.8%, a difference of 0.25%), Scotch-Irish (22.9%, a difference of 0.41%), Immigrants from Laos (22.9%, a difference of 0.48%), Celtic (22.7%, a difference of 0.52%), and White/Caucasian (22.7%, a difference of 0.59%). Similarly, the demographic groups most similar to Fijians are Hmong (23.1%, a difference of 0.030%), Senegalese (23.0%, a difference of 0.070%), Immigrants from Micronesia (23.0%, a difference of 0.13%), Inupiat (23.1%, a difference of 0.28%), and Central American (23.0%, a difference of 0.34%).
| Demographics | Rating | Rank | Single Female Poverty |
| Immigrants | Sudan | 0.8 /100 | #255 | Tragic 22.6% |
| Immigrants | Belize | 0.8 /100 | #256 | Tragic 22.6% |
| Sudanese | 0.7 /100 | #257 | Tragic 22.6% |
| Bahamians | 0.6 /100 | #258 | Tragic 22.7% |
| Whites/Caucasians | 0.6 /100 | #259 | Tragic 22.7% |
| Celtics | 0.5 /100 | #260 | Tragic 22.7% |
| Immigrants | Cabo Verde | 0.4 /100 | #261 | Tragic 22.8% |
| British West Indians | 0.4 /100 | #262 | Tragic 22.8% |
| Scotch-Irish | 0.3 /100 | #263 | Tragic 22.9% |
| Immigrants | Laos | 0.3 /100 | #264 | Tragic 22.9% |
| Central Americans | 0.2 /100 | #265 | Tragic 23.0% |
| Immigrants | Micronesia | 0.2 /100 | #266 | Tragic 23.0% |
| Senegalese | 0.2 /100 | #267 | Tragic 23.0% |
| Fijians | 0.2 /100 | #268 | Tragic 23.1% |
| Hmong | 0.2 /100 | #269 | Tragic 23.1% |
| Inupiat | 0.2 /100 | #270 | Tragic 23.1% |
| Sub-Saharan Africans | 0.1 /100 | #271 | Tragic 23.2% |
| Immigrants | Senegal | 0.1 /100 | #272 | Tragic 23.2% |
| Alaska Natives | 0.1 /100 | #273 | Tragic 23.3% |
| Marshallese | 0.1 /100 | #274 | Tragic 23.3% |
| Mexican American Indians | 0.1 /100 | #275 | Tragic 23.4% |