Blackfeet vs Immigrants from Belgium Householder Income Under 25 years
COMPARE
Blackfeet
Immigrants from Belgium
Householder Income Under 25 years
Householder Income Under 25 years Comparison
Blackfeet
Immigrants from Belgium
$48,603
HOUSEHOLDER INCOME UNDER 25 YEARS
0.0/ 100
METRIC RATING
296th/ 347
METRIC RANK
$54,830
HOUSEHOLDER INCOME UNDER 25 YEARS
99.8/ 100
METRIC RATING
63rd/ 347
METRIC RANK
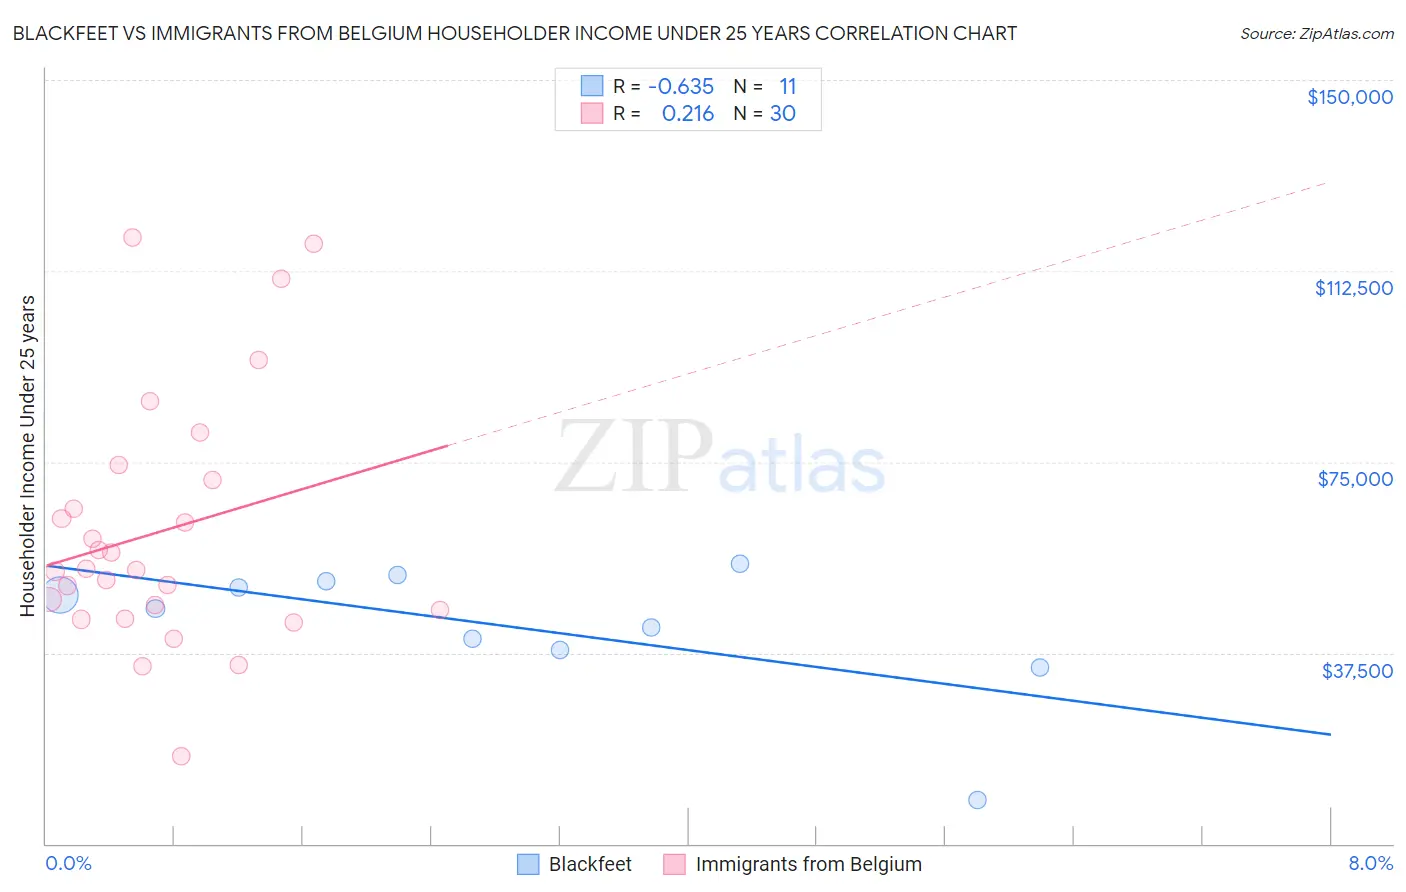
Blackfeet vs Immigrants from Belgium Householder Income Under 25 years Correlation Chart
The statistical analysis conducted on geographies consisting of 272,591,865 people shows a significant negative correlation between the proportion of Blackfeet and household income with householder under the age of 25 in the United States with a correlation coefficient (R) of -0.635 and weighted average of $48,603. Similarly, the statistical analysis conducted on geographies consisting of 131,972,517 people shows a weak positive correlation between the proportion of Immigrants from Belgium and household income with householder under the age of 25 in the United States with a correlation coefficient (R) of 0.216 and weighted average of $54,830, a difference of 12.8%.
Householder Income Under 25 years Correlation Summary
| Measurement | Blackfeet | Immigrants from Belgium |
| Minimum | $8,611 | $17,103 |
| Maximum | $55,000 | $119,035 |
| Range | $46,389 | $101,933 |
| Mean | $42,623 | $61,275 |
| Median | $46,273 | $53,928 |
| Interquartile 25% (IQ1) | $38,076 | $46,000 |
| Interquartile 75% (IQ3) | $51,620 | $71,485 |
| Interquartile Range (IQR) | $13,544 | $25,485 |
| Standard Deviation (Sample) | $13,025 | $24,412 |
| Standard Deviation (Population) | $12,419 | $24,002 |
Similar Demographics by Householder Income Under 25 years
Demographics Similar to Blackfeet by Householder Income Under 25 years
In terms of householder income under 25 years, the demographic groups most similar to Blackfeet are Central American Indian ($48,643, a difference of 0.080%), Somali ($48,657, a difference of 0.11%), Subsaharan African ($48,691, a difference of 0.18%), Cree ($48,514, a difference of 0.18%), and Shoshone ($48,720, a difference of 0.24%).
| Demographics | Rating | Rank | Householder Income Under 25 years |
| Hondurans | 0.0 /100 | #289 | Tragic $48,885 |
| Americans | 0.0 /100 | #290 | Tragic $48,860 |
| Immigrants | Burma/Myanmar | 0.0 /100 | #291 | Tragic $48,749 |
| Shoshone | 0.0 /100 | #292 | Tragic $48,720 |
| Sub-Saharan Africans | 0.0 /100 | #293 | Tragic $48,691 |
| Somalis | 0.0 /100 | #294 | Tragic $48,657 |
| Central American Indians | 0.0 /100 | #295 | Tragic $48,643 |
| Blackfeet | 0.0 /100 | #296 | Tragic $48,603 |
| Cree | 0.0 /100 | #297 | Tragic $48,514 |
| Yaqui | 0.0 /100 | #298 | Tragic $48,300 |
| Immigrants | Honduras | 0.0 /100 | #299 | Tragic $48,267 |
| Immigrants | Somalia | 0.0 /100 | #300 | Tragic $48,135 |
| Immigrants | Kuwait | 0.0 /100 | #301 | Tragic $48,126 |
| Immigrants | Liberia | 0.0 /100 | #302 | Tragic $47,981 |
| Immigrants | Middle Africa | 0.0 /100 | #303 | Tragic $47,916 |
Demographics Similar to Immigrants from Belgium by Householder Income Under 25 years
In terms of householder income under 25 years, the demographic groups most similar to Immigrants from Belgium are Immigrants from Uzbekistan ($54,846, a difference of 0.030%), Burmese ($54,800, a difference of 0.060%), Yup'ik ($54,732, a difference of 0.18%), Immigrants from Bangladesh ($54,714, a difference of 0.21%), and Okinawan ($54,701, a difference of 0.24%).
| Demographics | Rating | Rank | Householder Income Under 25 years |
| Salvadorans | 100.0 /100 | #56 | Exceptional $55,412 |
| Soviet Union | 100.0 /100 | #57 | Exceptional $55,340 |
| Guyanese | 99.9 /100 | #58 | Exceptional $55,210 |
| Native Hawaiians | 99.9 /100 | #59 | Exceptional $55,158 |
| Immigrants | Lithuania | 99.9 /100 | #60 | Exceptional $55,028 |
| Immigrants | Europe | 99.9 /100 | #61 | Exceptional $55,022 |
| Immigrants | Uzbekistan | 99.8 /100 | #62 | Exceptional $54,846 |
| Immigrants | Belgium | 99.8 /100 | #63 | Exceptional $54,830 |
| Burmese | 99.8 /100 | #64 | Exceptional $54,800 |
| Yup'ik | 99.8 /100 | #65 | Exceptional $54,732 |
| Immigrants | Bangladesh | 99.8 /100 | #66 | Exceptional $54,714 |
| Okinawans | 99.8 /100 | #67 | Exceptional $54,701 |
| Tsimshian | 99.8 /100 | #68 | Exceptional $54,649 |
| Samoans | 99.7 /100 | #69 | Exceptional $54,610 |
| Immigrants | El Salvador | 99.7 /100 | #70 | Exceptional $54,599 |