Belgian vs Immigrants from India Child Poverty Among Boys Under 16
COMPARE
Belgian
Immigrants from India
Child Poverty Among Boys Under 16
Child Poverty Among Boys Under 16 Comparison
Belgians
Immigrants from India
15.2%
CHILD POVERTY AMONG BOYS UNDER 16
93.1/ 100
METRIC RATING
119th/ 347
METRIC RANK
10.9%
CHILD POVERTY AMONG BOYS UNDER 16
100.0/ 100
METRIC RATING
1st/ 347
METRIC RANK
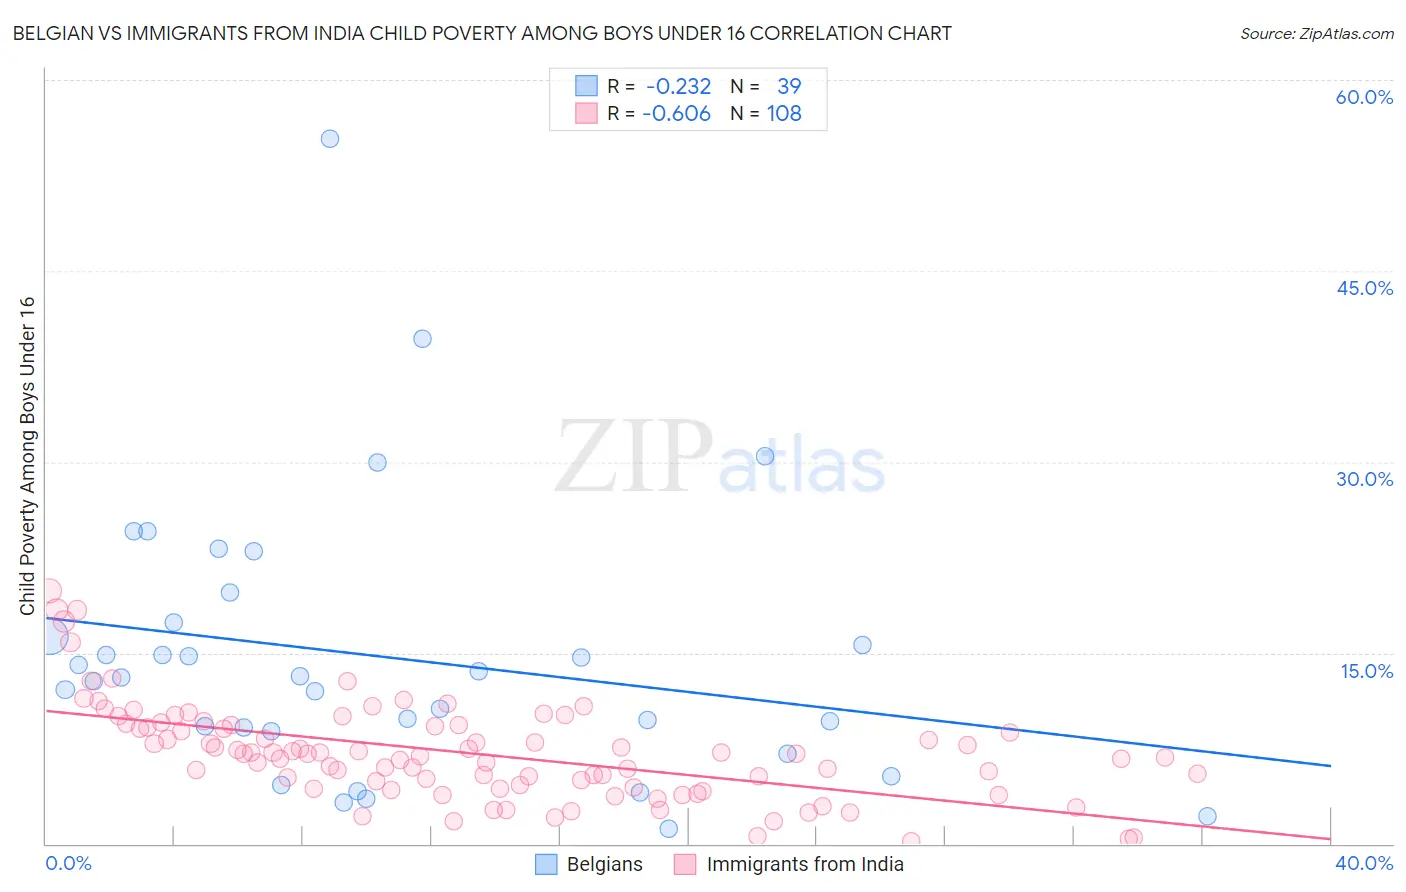
Belgian vs Immigrants from India Child Poverty Among Boys Under 16 Correlation Chart
The statistical analysis conducted on geographies consisting of 349,253,372 people shows a weak negative correlation between the proportion of Belgians and poverty level among boys under the age of 16 in the United States with a correlation coefficient (R) of -0.232 and weighted average of 15.2%. Similarly, the statistical analysis conducted on geographies consisting of 425,029,867 people shows a significant negative correlation between the proportion of Immigrants from India and poverty level among boys under the age of 16 in the United States with a correlation coefficient (R) of -0.606 and weighted average of 10.9%, a difference of 40.3%.
Child Poverty Among Boys Under 16 Correlation Summary
| Measurement | Belgian | Immigrants from India |
| Minimum | 1.2% | 0.23% |
| Maximum | 55.4% | 19.9% |
| Range | 54.2% | 19.6% |
| Mean | 14.7% | 7.1% |
| Median | 13.0% | 7.0% |
| Interquartile 25% (IQ1) | 8.8% | 4.5% |
| Interquartile 75% (IQ3) | 17.4% | 9.3% |
| Interquartile Range (IQR) | 8.6% | 4.8% |
| Standard Deviation (Sample) | 10.8% | 3.8% |
| Standard Deviation (Population) | 10.6% | 3.8% |
Similar Demographics by Child Poverty Among Boys Under 16
Demographics Similar to Belgians by Child Poverty Among Boys Under 16
In terms of child poverty among boys under 16, the demographic groups most similar to Belgians are South African (15.2%, a difference of 0.050%), Scottish (15.2%, a difference of 0.060%), Native Hawaiian (15.2%, a difference of 0.12%), Immigrants from Malaysia (15.3%, a difference of 0.16%), and Immigrants from Vietnam (15.2%, a difference of 0.18%).
| Demographics | Rating | Rank | Child Poverty Among Boys Under 16 |
| Basques | 93.8 /100 | #112 | Exceptional 15.2% |
| Irish | 93.8 /100 | #113 | Exceptional 15.2% |
| Immigrants | Ukraine | 93.6 /100 | #114 | Exceptional 15.2% |
| Armenians | 93.6 /100 | #115 | Exceptional 15.2% |
| Immigrants | South Eastern Asia | 93.5 /100 | #116 | Exceptional 15.2% |
| Immigrants | Vietnam | 93.5 /100 | #117 | Exceptional 15.2% |
| Native Hawaiians | 93.4 /100 | #118 | Exceptional 15.2% |
| Belgians | 93.1 /100 | #119 | Exceptional 15.2% |
| South Africans | 93.0 /100 | #120 | Exceptional 15.2% |
| Scottish | 93.0 /100 | #121 | Exceptional 15.2% |
| Immigrants | Malaysia | 92.8 /100 | #122 | Exceptional 15.3% |
| Immigrants | Norway | 92.3 /100 | #123 | Exceptional 15.3% |
| Tlingit-Haida | 92.2 /100 | #124 | Exceptional 15.3% |
| Czechoslovakians | 92.1 /100 | #125 | Exceptional 15.3% |
| Palestinians | 91.3 /100 | #126 | Exceptional 15.4% |
Demographics Similar to Immigrants from India by Child Poverty Among Boys Under 16
In terms of child poverty among boys under 16, the demographic groups most similar to Immigrants from India are Immigrants from Taiwan (11.0%, a difference of 1.5%), Filipino (11.1%, a difference of 2.3%), Thai (11.7%, a difference of 7.5%), Chinese (11.9%, a difference of 9.2%), and Immigrants from Hong Kong (12.3%, a difference of 12.8%).
| Demographics | Rating | Rank | Child Poverty Among Boys Under 16 |
| Immigrants | India | 100.0 /100 | #1 | Exceptional 10.9% |
| Immigrants | Taiwan | 100.0 /100 | #2 | Exceptional 11.0% |
| Filipinos | 100.0 /100 | #3 | Exceptional 11.1% |
| Thais | 100.0 /100 | #4 | Exceptional 11.7% |
| Chinese | 100.0 /100 | #5 | Exceptional 11.9% |
| Immigrants | Hong Kong | 100.0 /100 | #6 | Exceptional 12.3% |
| Iranians | 100.0 /100 | #7 | Exceptional 12.4% |
| Immigrants | Singapore | 100.0 /100 | #8 | Exceptional 12.5% |
| Immigrants | Iran | 100.0 /100 | #9 | Exceptional 12.5% |
| Bhutanese | 100.0 /100 | #10 | Exceptional 12.6% |
| Immigrants | South Central Asia | 100.0 /100 | #11 | Exceptional 12.7% |
| Burmese | 99.9 /100 | #12 | Exceptional 13.0% |
| Immigrants | Korea | 99.9 /100 | #13 | Exceptional 13.0% |
| Immigrants | Ireland | 99.9 /100 | #14 | Exceptional 13.1% |
| Immigrants | Japan | 99.9 /100 | #15 | Exceptional 13.1% |