Basque vs Immigrants from Northern Europe Child Poverty Among Girls Under 16
COMPARE
Basque
Immigrants from Northern Europe
Child Poverty Among Girls Under 16
Child Poverty Among Girls Under 16 Comparison
Basques
Immigrants from Northern Europe
15.0%
CHILD POVERTY AMONG GIRLS UNDER 16
95.9/ 100
METRIC RATING
98th/ 347
METRIC RANK
13.8%
CHILD POVERTY AMONG GIRLS UNDER 16
99.6/ 100
METRIC RATING
35th/ 347
METRIC RANK
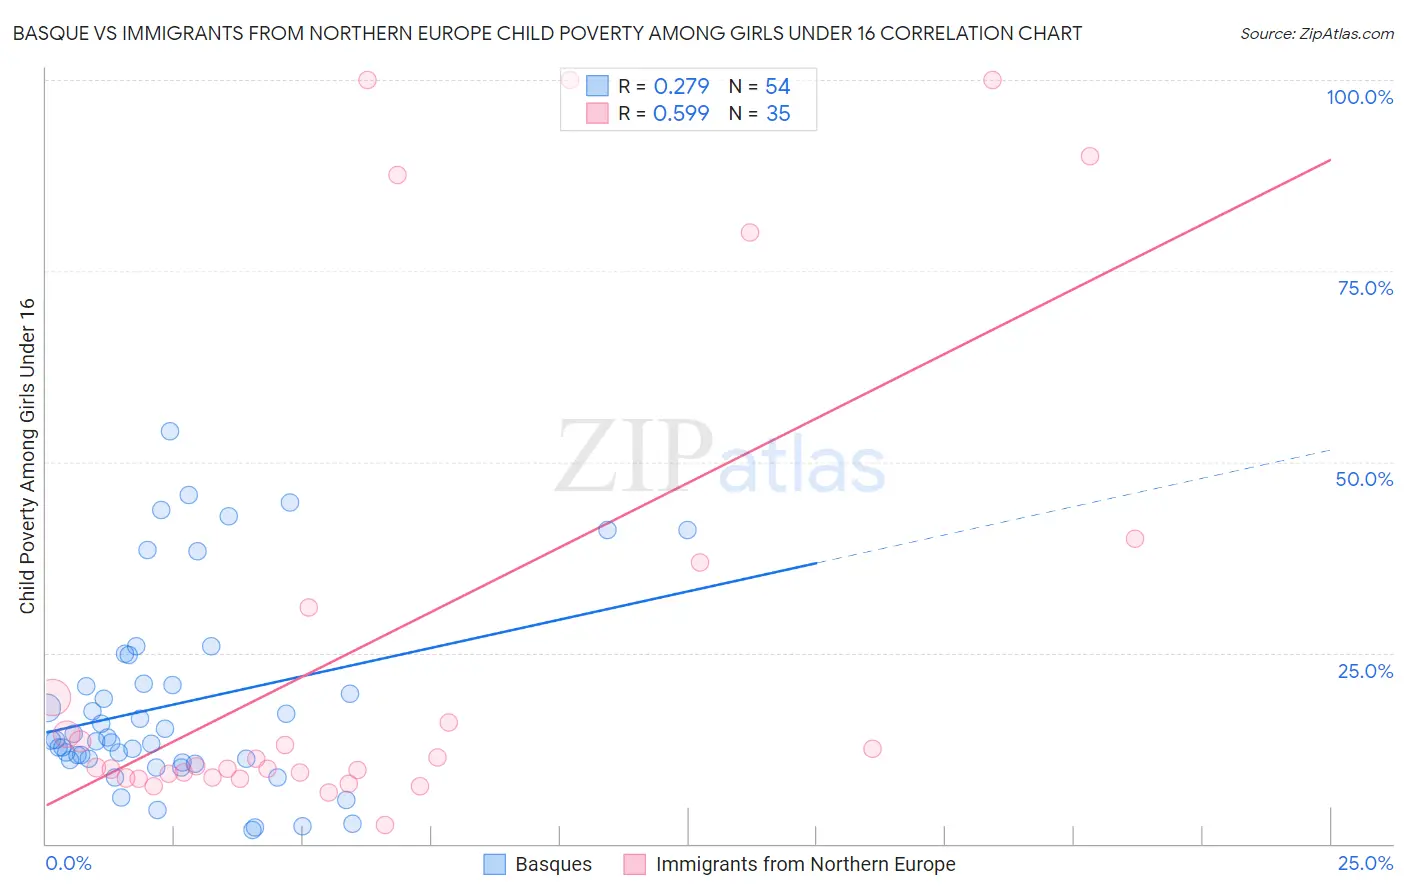
Basque vs Immigrants from Northern Europe Child Poverty Among Girls Under 16 Correlation Chart
The statistical analysis conducted on geographies consisting of 164,410,645 people shows a weak positive correlation between the proportion of Basques and poverty level among girls under the age of 16 in the United States with a correlation coefficient (R) of 0.279 and weighted average of 15.0%. Similarly, the statistical analysis conducted on geographies consisting of 463,851,926 people shows a substantial positive correlation between the proportion of Immigrants from Northern Europe and poverty level among girls under the age of 16 in the United States with a correlation coefficient (R) of 0.599 and weighted average of 13.8%, a difference of 8.2%.
Child Poverty Among Girls Under 16 Correlation Summary
| Measurement | Basque | Immigrants from Northern Europe |
| Minimum | 1.8% | 2.4% |
| Maximum | 54.1% | 100.0% |
| Range | 52.2% | 97.6% |
| Mean | 18.3% | 26.6% |
| Median | 13.6% | 10.2% |
| Interquartile 25% (IQ1) | 10.9% | 8.7% |
| Interquartile 75% (IQ3) | 20.9% | 30.9% |
| Interquartile Range (IQR) | 9.9% | 22.2% |
| Standard Deviation (Sample) | 12.7% | 31.8% |
| Standard Deviation (Population) | 12.6% | 31.3% |
Similar Demographics by Child Poverty Among Girls Under 16
Demographics Similar to Basques by Child Poverty Among Girls Under 16
In terms of child poverty among girls under 16, the demographic groups most similar to Basques are Immigrants from Egypt (15.0%, a difference of 0.15%), Immigrants from Latvia (14.9%, a difference of 0.19%), Paraguayan (15.0%, a difference of 0.20%), Immigrants from South Africa (15.0%, a difference of 0.23%), and Immigrants from Malaysia (15.0%, a difference of 0.24%).
| Demographics | Rating | Rank | Child Poverty Among Girls Under 16 |
| Immigrants | Belarus | 97.0 /100 | #91 | Exceptional 14.8% |
| Austrians | 96.7 /100 | #92 | Exceptional 14.9% |
| Immigrants | North America | 96.6 /100 | #93 | Exceptional 14.9% |
| Immigrants | Switzerland | 96.3 /100 | #94 | Exceptional 14.9% |
| Germans | 96.3 /100 | #95 | Exceptional 14.9% |
| Immigrants | France | 96.2 /100 | #96 | Exceptional 14.9% |
| Immigrants | Latvia | 96.1 /100 | #97 | Exceptional 14.9% |
| Basques | 95.9 /100 | #98 | Exceptional 15.0% |
| Immigrants | Egypt | 95.7 /100 | #99 | Exceptional 15.0% |
| Paraguayans | 95.7 /100 | #100 | Exceptional 15.0% |
| Immigrants | South Africa | 95.6 /100 | #101 | Exceptional 15.0% |
| Immigrants | Malaysia | 95.6 /100 | #102 | Exceptional 15.0% |
| British | 95.6 /100 | #103 | Exceptional 15.0% |
| Romanians | 95.3 /100 | #104 | Exceptional 15.0% |
| Immigrants | England | 95.1 /100 | #105 | Exceptional 15.1% |
Demographics Similar to Immigrants from Northern Europe by Child Poverty Among Girls Under 16
In terms of child poverty among girls under 16, the demographic groups most similar to Immigrants from Northern Europe are Russian (13.9%, a difference of 0.15%), Lithuanian (13.9%, a difference of 0.17%), Immigrants from Moldova (13.9%, a difference of 0.47%), Maltese (13.7%, a difference of 0.98%), and Swedish (13.7%, a difference of 1.0%).
| Demographics | Rating | Rank | Child Poverty Among Girls Under 16 |
| Tongans | 99.8 /100 | #28 | Exceptional 13.6% |
| Bolivians | 99.8 /100 | #29 | Exceptional 13.6% |
| Asians | 99.7 /100 | #30 | Exceptional 13.7% |
| Turks | 99.7 /100 | #31 | Exceptional 13.7% |
| Danes | 99.7 /100 | #32 | Exceptional 13.7% |
| Swedes | 99.7 /100 | #33 | Exceptional 13.7% |
| Maltese | 99.7 /100 | #34 | Exceptional 13.7% |
| Immigrants | Northern Europe | 99.6 /100 | #35 | Exceptional 13.8% |
| Russians | 99.6 /100 | #36 | Exceptional 13.9% |
| Lithuanians | 99.6 /100 | #37 | Exceptional 13.9% |
| Immigrants | Moldova | 99.6 /100 | #38 | Exceptional 13.9% |
| Immigrants | Australia | 99.5 /100 | #39 | Exceptional 14.0% |
| Immigrants | Sri Lanka | 99.5 /100 | #40 | Exceptional 14.0% |
| Immigrants | Bolivia | 99.5 /100 | #41 | Exceptional 14.0% |
| Immigrants | Scotland | 99.4 /100 | #42 | Exceptional 14.0% |