Basque vs Immigrants from Canada Receiving Food Stamps
COMPARE
Basque
Immigrants from Canada
Receiving Food Stamps
Receiving Food Stamps Comparison
Basques
Immigrants from Canada
10.3%
RECEIVING FOOD STAMPS
97.4/ 100
METRIC RATING
95th/ 347
METRIC RANK
9.7%
RECEIVING FOOD STAMPS
99.3/ 100
METRIC RATING
56th/ 347
METRIC RANK
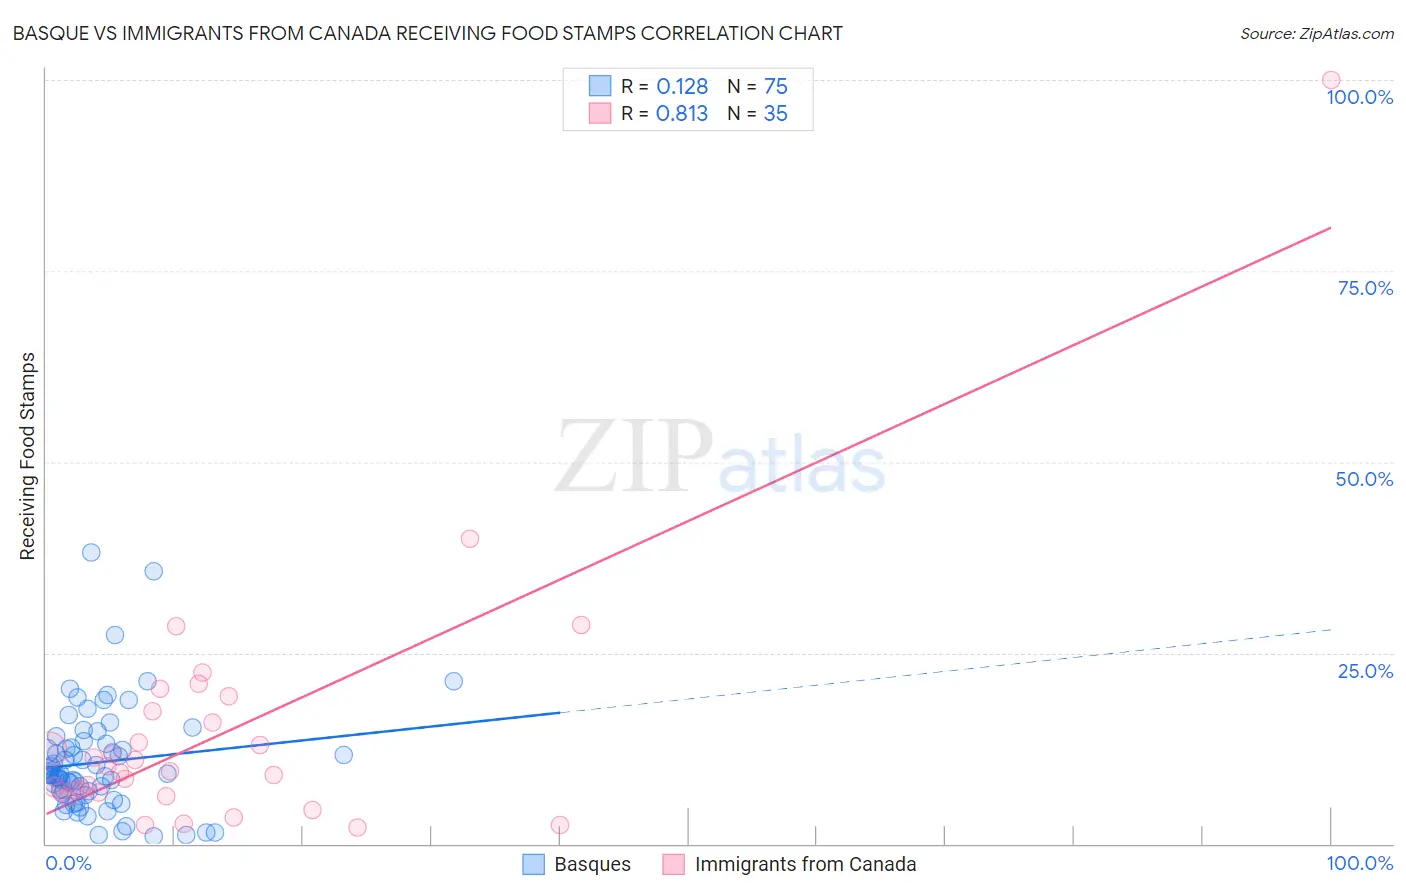
Basque vs Immigrants from Canada Receiving Food Stamps Correlation Chart
The statistical analysis conducted on geographies consisting of 165,638,020 people shows a poor positive correlation between the proportion of Basques and percentage of population receiving government assistance and/or food stamps in the United States with a correlation coefficient (R) of 0.128 and weighted average of 10.3%. Similarly, the statistical analysis conducted on geographies consisting of 457,609,455 people shows a very strong positive correlation between the proportion of Immigrants from Canada and percentage of population receiving government assistance and/or food stamps in the United States with a correlation coefficient (R) of 0.813 and weighted average of 9.7%, a difference of 5.6%.
Receiving Food Stamps Correlation Summary
| Measurement | Basque | Immigrants from Canada |
| Minimum | 1.0% | 2.1% |
| Maximum | 38.2% | 100.0% |
| Range | 37.2% | 97.9% |
| Mean | 10.7% | 14.4% |
| Median | 9.1% | 9.6% |
| Interquartile 25% (IQ1) | 6.5% | 6.7% |
| Interquartile 75% (IQ3) | 13.1% | 17.4% |
| Interquartile Range (IQR) | 6.6% | 10.7% |
| Standard Deviation (Sample) | 7.0% | 17.1% |
| Standard Deviation (Population) | 6.9% | 16.9% |
Similar Demographics by Receiving Food Stamps
Demographics Similar to Basques by Receiving Food Stamps
In terms of receiving food stamps, the demographic groups most similar to Basques are Immigrants from Greece (10.3%, a difference of 0.030%), Welsh (10.3%, a difference of 0.050%), Czechoslovakian (10.3%, a difference of 0.31%), Immigrants from Egypt (10.3%, a difference of 0.37%), and Serbian (10.3%, a difference of 0.54%).
| Demographics | Rating | Rank | Receiving Food Stamps |
| Immigrants | Kuwait | 98.4 /100 | #88 | Exceptional 10.0% |
| Immigrants | France | 98.3 /100 | #89 | Exceptional 10.1% |
| Finns | 97.9 /100 | #90 | Exceptional 10.2% |
| Jordanians | 97.9 /100 | #91 | Exceptional 10.2% |
| Irish | 97.9 /100 | #92 | Exceptional 10.2% |
| Belgians | 97.7 /100 | #93 | Exceptional 10.2% |
| Immigrants | Greece | 97.4 /100 | #94 | Exceptional 10.3% |
| Basques | 97.4 /100 | #95 | Exceptional 10.3% |
| Welsh | 97.3 /100 | #96 | Exceptional 10.3% |
| Czechoslovakians | 97.2 /100 | #97 | Exceptional 10.3% |
| Immigrants | Egypt | 97.1 /100 | #98 | Exceptional 10.3% |
| Serbians | 97.0 /100 | #99 | Exceptional 10.3% |
| Immigrants | Western Europe | 96.9 /100 | #100 | Exceptional 10.3% |
| Palestinians | 96.9 /100 | #101 | Exceptional 10.3% |
| Immigrants | Europe | 96.8 /100 | #102 | Exceptional 10.3% |
Demographics Similar to Immigrants from Canada by Receiving Food Stamps
In terms of receiving food stamps, the demographic groups most similar to Immigrants from Canada are Greek (9.7%, a difference of 0.11%), Scandinavian (9.7%, a difference of 0.17%), Immigrants from Switzerland (9.7%, a difference of 0.18%), Swiss (9.7%, a difference of 0.19%), and British (9.7%, a difference of 0.20%).
| Demographics | Rating | Rank | Receiving Food Stamps |
| Immigrants | Czechoslovakia | 99.4 /100 | #49 | Exceptional 9.6% |
| Lithuanians | 99.4 /100 | #50 | Exceptional 9.7% |
| Asians | 99.3 /100 | #51 | Exceptional 9.7% |
| Immigrants | South Africa | 99.3 /100 | #52 | Exceptional 9.7% |
| Tongans | 99.3 /100 | #53 | Exceptional 9.7% |
| Swiss | 99.3 /100 | #54 | Exceptional 9.7% |
| Immigrants | Switzerland | 99.3 /100 | #55 | Exceptional 9.7% |
| Immigrants | Canada | 99.3 /100 | #56 | Exceptional 9.7% |
| Greeks | 99.3 /100 | #57 | Exceptional 9.7% |
| Scandinavians | 99.2 /100 | #58 | Exceptional 9.7% |
| British | 99.2 /100 | #59 | Exceptional 9.7% |
| Germans | 99.2 /100 | #60 | Exceptional 9.7% |
| English | 99.2 /100 | #61 | Exceptional 9.8% |
| Immigrants | Bulgaria | 99.2 /100 | #62 | Exceptional 9.8% |
| Chinese | 99.2 /100 | #63 | Exceptional 9.8% |