Bangladeshi vs Lithuanian Seniors Poverty Over the Age of 75
COMPARE
Bangladeshi
Lithuanian
Seniors Poverty Over the Age of 75
Seniors Poverty Over the Age of 75 Comparison
Bangladeshis
Lithuanians
12.0%
SENIORS POVERTY OVER THE AGE OF 75
70.4/ 100
METRIC RATING
146th/ 347
METRIC RANK
10.6%
SENIORS POVERTY OVER THE AGE OF 75
99.8/ 100
METRIC RATING
23rd/ 347
METRIC RANK
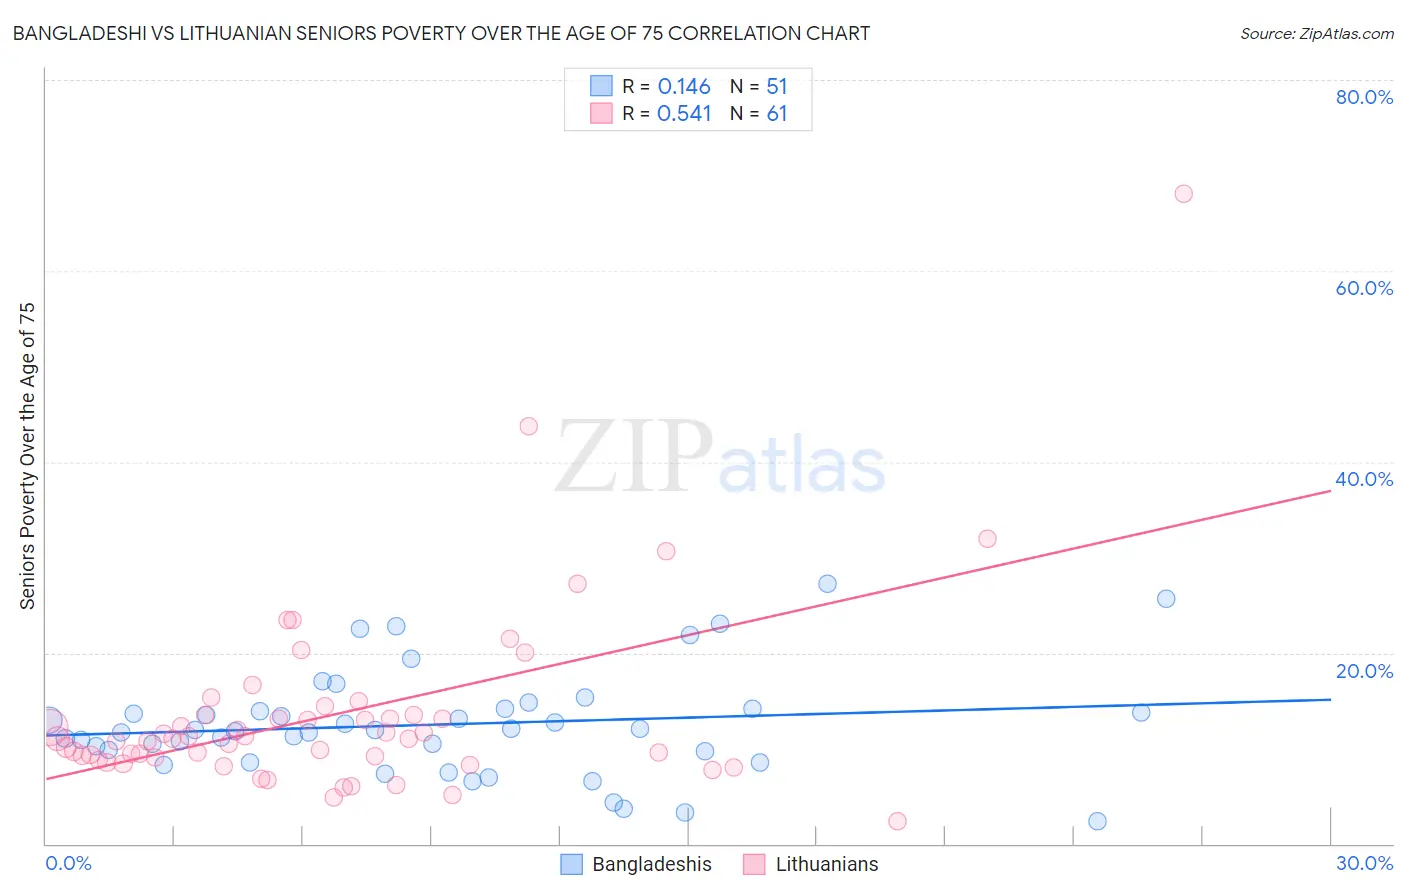
Bangladeshi vs Lithuanian Seniors Poverty Over the Age of 75 Correlation Chart
The statistical analysis conducted on geographies consisting of 140,437,796 people shows a poor positive correlation between the proportion of Bangladeshis and poverty level among seniors over the age of 75 in the United States with a correlation coefficient (R) of 0.146 and weighted average of 12.0%. Similarly, the statistical analysis conducted on geographies consisting of 415,702,438 people shows a substantial positive correlation between the proportion of Lithuanians and poverty level among seniors over the age of 75 in the United States with a correlation coefficient (R) of 0.541 and weighted average of 10.6%, a difference of 13.2%.
Seniors Poverty Over the Age of 75 Correlation Summary
| Measurement | Bangladeshi | Lithuanian |
| Minimum | 2.3% | 2.3% |
| Maximum | 27.3% | 68.1% |
| Range | 24.9% | 65.8% |
| Mean | 12.5% | 13.6% |
| Median | 11.9% | 11.0% |
| Interquartile 25% (IQ1) | 9.7% | 8.9% |
| Interquartile 75% (IQ3) | 14.1% | 13.5% |
| Interquartile Range (IQR) | 4.3% | 4.5% |
| Standard Deviation (Sample) | 5.4% | 10.0% |
| Standard Deviation (Population) | 5.4% | 10.0% |
Similar Demographics by Seniors Poverty Over the Age of 75
Demographics Similar to Bangladeshis by Seniors Poverty Over the Age of 75
In terms of seniors poverty over the age of 75, the demographic groups most similar to Bangladeshis are Hmong (12.0%, a difference of 0.050%), Immigrants from Belgium (12.0%, a difference of 0.050%), American (12.0%, a difference of 0.060%), Immigrants from Laos (12.0%, a difference of 0.11%), and Immigrants from Latvia (12.0%, a difference of 0.12%).
| Demographics | Rating | Rank | Seniors Poverty Over the Age of 75 |
| Immigrants | Kenya | 72.6 /100 | #139 | Good 11.9% |
| Immigrants | Pakistan | 71.9 /100 | #140 | Good 12.0% |
| Immigrants | Cameroon | 71.7 /100 | #141 | Good 12.0% |
| Immigrants | Laos | 71.5 /100 | #142 | Good 12.0% |
| Americans | 71.0 /100 | #143 | Good 12.0% |
| Hmong | 70.8 /100 | #144 | Good 12.0% |
| Immigrants | Belgium | 70.8 /100 | #145 | Good 12.0% |
| Bangladeshis | 70.4 /100 | #146 | Good 12.0% |
| Immigrants | Latvia | 69.1 /100 | #147 | Good 12.0% |
| Immigrants | Zaire | 67.6 /100 | #148 | Good 12.0% |
| Asians | 67.4 /100 | #149 | Good 12.0% |
| Cypriots | 67.3 /100 | #150 | Good 12.0% |
| Cherokee | 65.8 /100 | #151 | Good 12.0% |
| Immigrants | Korea | 65.5 /100 | #152 | Good 12.0% |
| Immigrants | Turkey | 64.7 /100 | #153 | Good 12.0% |
Demographics Similar to Lithuanians by Seniors Poverty Over the Age of 75
In terms of seniors poverty over the age of 75, the demographic groups most similar to Lithuanians are Bhutanese (10.6%, a difference of 0.020%), Polish (10.6%, a difference of 0.070%), Menominee (10.6%, a difference of 0.090%), Slovene (10.6%, a difference of 0.28%), and Czech (10.5%, a difference of 0.32%).
| Demographics | Rating | Rank | Seniors Poverty Over the Age of 75 |
| Dutch | 99.9 /100 | #16 | Exceptional 10.5% |
| Slovaks | 99.9 /100 | #17 | Exceptional 10.5% |
| Welsh | 99.9 /100 | #18 | Exceptional 10.5% |
| Immigrants | Scotland | 99.9 /100 | #19 | Exceptional 10.5% |
| Czechs | 99.9 /100 | #20 | Exceptional 10.5% |
| Slovenes | 99.9 /100 | #21 | Exceptional 10.6% |
| Bhutanese | 99.8 /100 | #22 | Exceptional 10.6% |
| Lithuanians | 99.8 /100 | #23 | Exceptional 10.6% |
| Poles | 99.8 /100 | #24 | Exceptional 10.6% |
| Menominee | 99.8 /100 | #25 | Exceptional 10.6% |
| Bulgarians | 99.8 /100 | #26 | Exceptional 10.7% |
| Northern Europeans | 99.8 /100 | #27 | Exceptional 10.7% |
| Irish | 99.8 /100 | #28 | Exceptional 10.7% |
| Assyrians/Chaldeans/Syriacs | 99.8 /100 | #29 | Exceptional 10.7% |
| Swiss | 99.7 /100 | #30 | Exceptional 10.7% |