Jamaican vs Lithuanian Seniors Poverty Over the Age of 75
COMPARE
Jamaican
Lithuanian
Seniors Poverty Over the Age of 75
Seniors Poverty Over the Age of 75 Comparison
Jamaicans
Lithuanians
15.1%
SENIORS POVERTY OVER THE AGE OF 75
0.0/ 100
METRIC RATING
288th/ 347
METRIC RANK
10.6%
SENIORS POVERTY OVER THE AGE OF 75
99.8/ 100
METRIC RATING
23rd/ 347
METRIC RANK
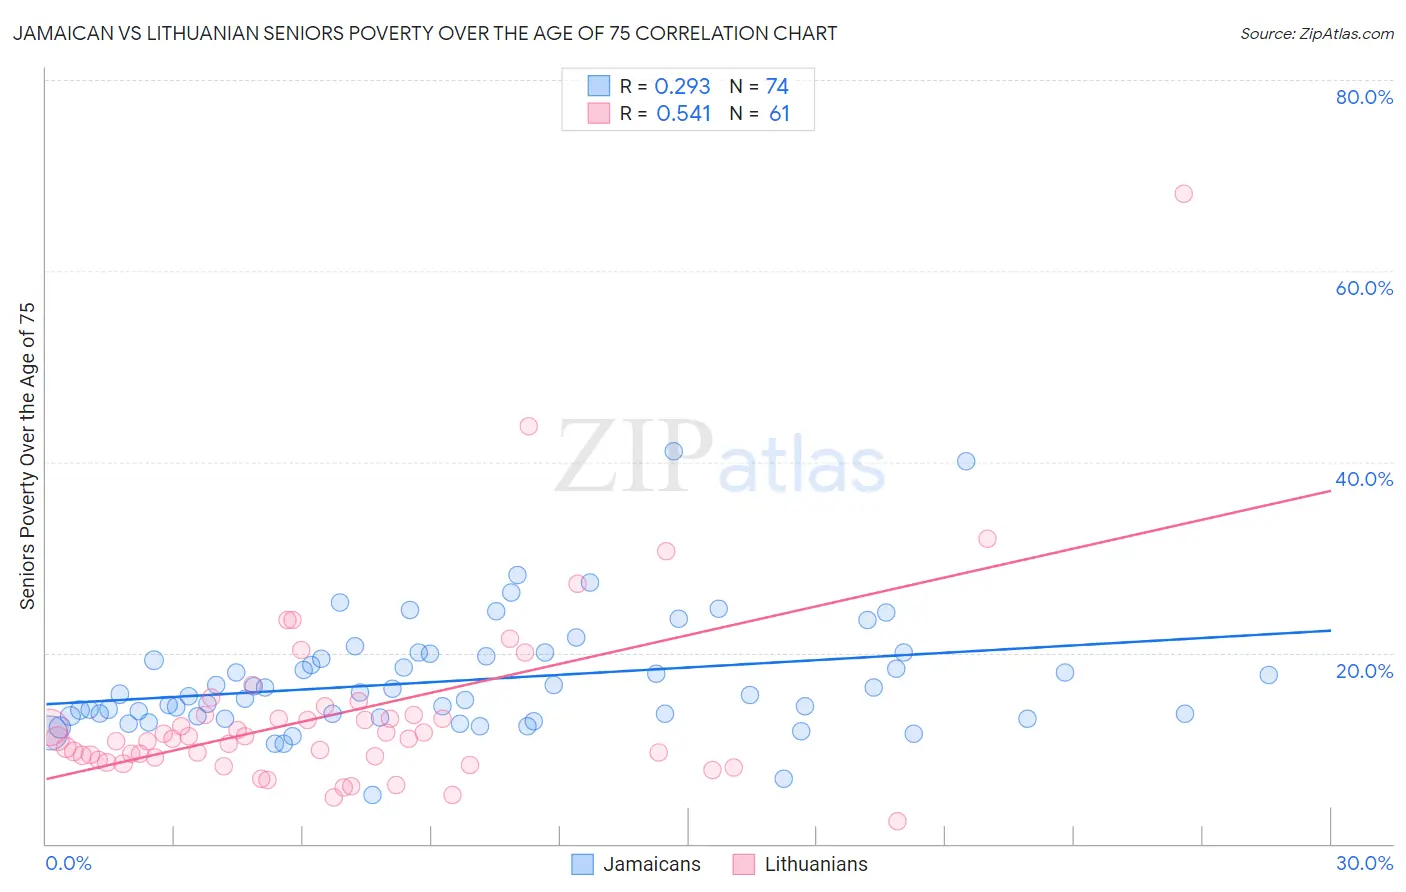
Jamaican vs Lithuanian Seniors Poverty Over the Age of 75 Correlation Chart
The statistical analysis conducted on geographies consisting of 363,692,137 people shows a weak positive correlation between the proportion of Jamaicans and poverty level among seniors over the age of 75 in the United States with a correlation coefficient (R) of 0.293 and weighted average of 15.1%. Similarly, the statistical analysis conducted on geographies consisting of 415,702,438 people shows a substantial positive correlation between the proportion of Lithuanians and poverty level among seniors over the age of 75 in the United States with a correlation coefficient (R) of 0.541 and weighted average of 10.6%, a difference of 43.1%.
Seniors Poverty Over the Age of 75 Correlation Summary
| Measurement | Jamaican | Lithuanian |
| Minimum | 5.1% | 2.3% |
| Maximum | 41.1% | 68.1% |
| Range | 35.9% | 65.8% |
| Mean | 17.1% | 13.6% |
| Median | 15.6% | 11.0% |
| Interquartile 25% (IQ1) | 13.4% | 8.9% |
| Interquartile 75% (IQ3) | 19.7% | 13.5% |
| Interquartile Range (IQR) | 6.3% | 4.5% |
| Standard Deviation (Sample) | 6.1% | 10.0% |
| Standard Deviation (Population) | 6.0% | 10.0% |
Similar Demographics by Seniors Poverty Over the Age of 75
Demographics Similar to Jamaicans by Seniors Poverty Over the Age of 75
In terms of seniors poverty over the age of 75, the demographic groups most similar to Jamaicans are Immigrants from Belize (15.2%, a difference of 0.26%), Immigrants from the Azores (15.2%, a difference of 0.28%), Paiute (15.2%, a difference of 0.29%), Colville (15.2%, a difference of 0.48%), and Immigrants from Guatemala (15.1%, a difference of 0.60%).
| Demographics | Rating | Rank | Seniors Poverty Over the Age of 75 |
| Belizeans | 0.0 /100 | #281 | Tragic 14.8% |
| Immigrants | Senegal | 0.0 /100 | #282 | Tragic 14.8% |
| Guatemalans | 0.0 /100 | #283 | Tragic 14.8% |
| Cheyenne | 0.0 /100 | #284 | Tragic 14.9% |
| Immigrants | Mexico | 0.0 /100 | #285 | Tragic 14.9% |
| Immigrants | Central America | 0.0 /100 | #286 | Tragic 15.0% |
| Immigrants | Guatemala | 0.0 /100 | #287 | Tragic 15.1% |
| Jamaicans | 0.0 /100 | #288 | Tragic 15.1% |
| Immigrants | Belize | 0.0 /100 | #289 | Tragic 15.2% |
| Immigrants | Azores | 0.0 /100 | #290 | Tragic 15.2% |
| Paiute | 0.0 /100 | #291 | Tragic 15.2% |
| Colville | 0.0 /100 | #292 | Tragic 15.2% |
| Apache | 0.0 /100 | #293 | Tragic 15.3% |
| Immigrants | Jamaica | 0.0 /100 | #294 | Tragic 15.3% |
| U.S. Virgin Islanders | 0.0 /100 | #295 | Tragic 15.4% |
Demographics Similar to Lithuanians by Seniors Poverty Over the Age of 75
In terms of seniors poverty over the age of 75, the demographic groups most similar to Lithuanians are Bhutanese (10.6%, a difference of 0.020%), Polish (10.6%, a difference of 0.070%), Menominee (10.6%, a difference of 0.090%), Slovene (10.6%, a difference of 0.28%), and Czech (10.5%, a difference of 0.32%).
| Demographics | Rating | Rank | Seniors Poverty Over the Age of 75 |
| Dutch | 99.9 /100 | #16 | Exceptional 10.5% |
| Slovaks | 99.9 /100 | #17 | Exceptional 10.5% |
| Welsh | 99.9 /100 | #18 | Exceptional 10.5% |
| Immigrants | Scotland | 99.9 /100 | #19 | Exceptional 10.5% |
| Czechs | 99.9 /100 | #20 | Exceptional 10.5% |
| Slovenes | 99.9 /100 | #21 | Exceptional 10.6% |
| Bhutanese | 99.8 /100 | #22 | Exceptional 10.6% |
| Lithuanians | 99.8 /100 | #23 | Exceptional 10.6% |
| Poles | 99.8 /100 | #24 | Exceptional 10.6% |
| Menominee | 99.8 /100 | #25 | Exceptional 10.6% |
| Bulgarians | 99.8 /100 | #26 | Exceptional 10.7% |
| Northern Europeans | 99.8 /100 | #27 | Exceptional 10.7% |
| Irish | 99.8 /100 | #28 | Exceptional 10.7% |
| Assyrians/Chaldeans/Syriacs | 99.8 /100 | #29 | Exceptional 10.7% |
| Swiss | 99.7 /100 | #30 | Exceptional 10.7% |