Bangladeshi vs Immigrants from Cambodia Seniors Poverty Over the Age of 75
COMPARE
Bangladeshi
Immigrants from Cambodia
Seniors Poverty Over the Age of 75
Seniors Poverty Over the Age of 75 Comparison
Bangladeshis
Immigrants from Cambodia
12.0%
SENIORS POVERTY OVER THE AGE OF 75
70.4/ 100
METRIC RATING
146th/ 347
METRIC RANK
13.6%
SENIORS POVERTY OVER THE AGE OF 75
0.4/ 100
METRIC RATING
246th/ 347
METRIC RANK
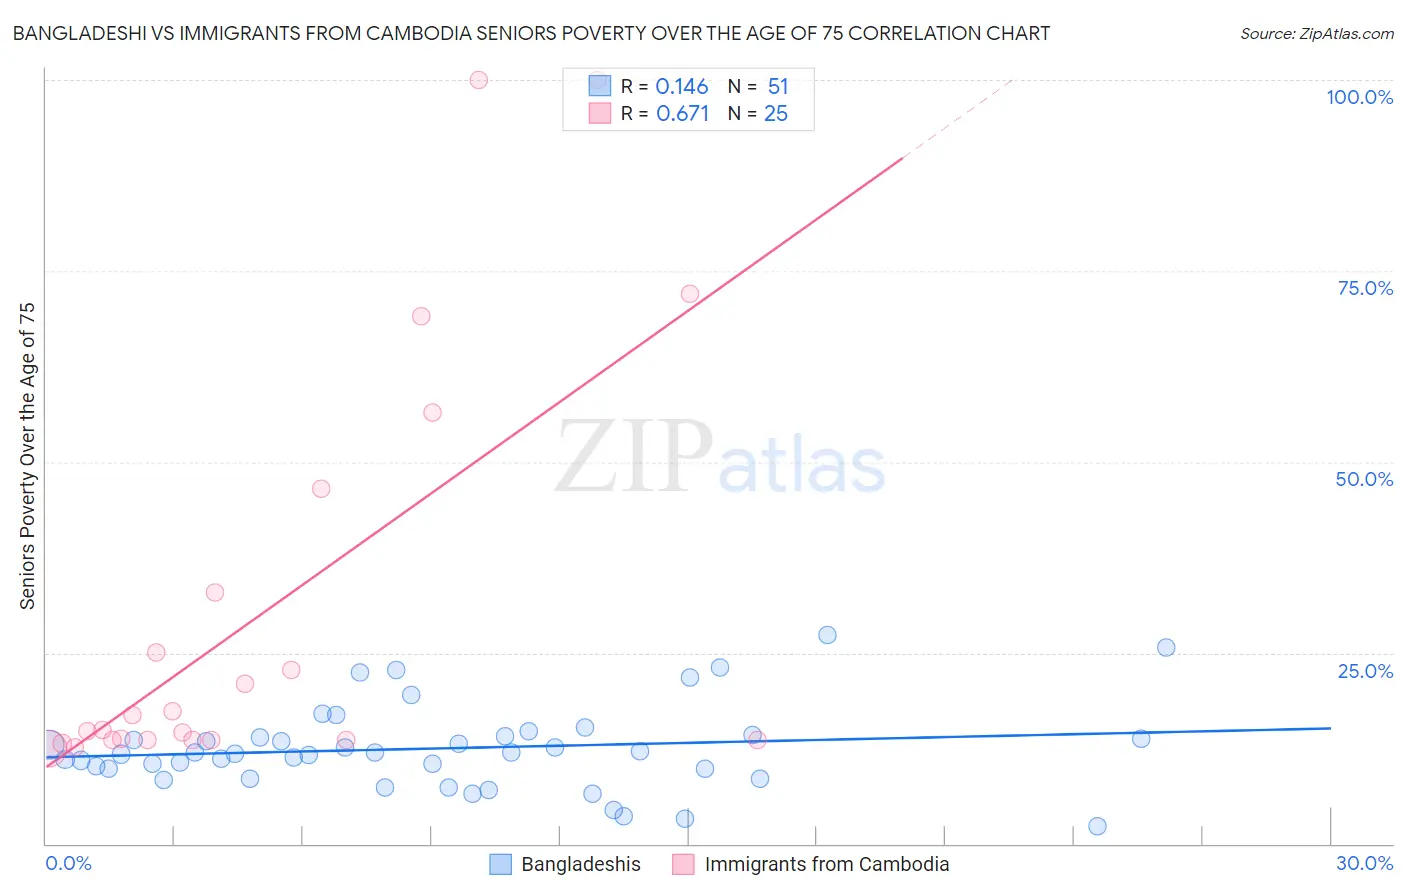
Bangladeshi vs Immigrants from Cambodia Seniors Poverty Over the Age of 75 Correlation Chart
The statistical analysis conducted on geographies consisting of 140,437,796 people shows a poor positive correlation between the proportion of Bangladeshis and poverty level among seniors over the age of 75 in the United States with a correlation coefficient (R) of 0.146 and weighted average of 12.0%. Similarly, the statistical analysis conducted on geographies consisting of 204,192,047 people shows a significant positive correlation between the proportion of Immigrants from Cambodia and poverty level among seniors over the age of 75 in the United States with a correlation coefficient (R) of 0.671 and weighted average of 13.6%, a difference of 13.2%.
Seniors Poverty Over the Age of 75 Correlation Summary
| Measurement | Bangladeshi | Immigrants from Cambodia |
| Minimum | 2.3% | 12.4% |
| Maximum | 27.3% | 100.0% |
| Range | 24.9% | 87.6% |
| Mean | 12.5% | 30.3% |
| Median | 11.9% | 14.9% |
| Interquartile 25% (IQ1) | 9.7% | 13.6% |
| Interquartile 75% (IQ3) | 14.1% | 39.7% |
| Interquartile Range (IQR) | 4.3% | 26.1% |
| Standard Deviation (Sample) | 5.4% | 27.4% |
| Standard Deviation (Population) | 5.4% | 26.9% |
Similar Demographics by Seniors Poverty Over the Age of 75
Demographics Similar to Bangladeshis by Seniors Poverty Over the Age of 75
In terms of seniors poverty over the age of 75, the demographic groups most similar to Bangladeshis are Hmong (12.0%, a difference of 0.050%), Immigrants from Belgium (12.0%, a difference of 0.050%), American (12.0%, a difference of 0.060%), Immigrants from Laos (12.0%, a difference of 0.11%), and Immigrants from Latvia (12.0%, a difference of 0.12%).
| Demographics | Rating | Rank | Seniors Poverty Over the Age of 75 |
| Immigrants | Kenya | 72.6 /100 | #139 | Good 11.9% |
| Immigrants | Pakistan | 71.9 /100 | #140 | Good 12.0% |
| Immigrants | Cameroon | 71.7 /100 | #141 | Good 12.0% |
| Immigrants | Laos | 71.5 /100 | #142 | Good 12.0% |
| Americans | 71.0 /100 | #143 | Good 12.0% |
| Hmong | 70.8 /100 | #144 | Good 12.0% |
| Immigrants | Belgium | 70.8 /100 | #145 | Good 12.0% |
| Bangladeshis | 70.4 /100 | #146 | Good 12.0% |
| Immigrants | Latvia | 69.1 /100 | #147 | Good 12.0% |
| Immigrants | Zaire | 67.6 /100 | #148 | Good 12.0% |
| Asians | 67.4 /100 | #149 | Good 12.0% |
| Cypriots | 67.3 /100 | #150 | Good 12.0% |
| Cherokee | 65.8 /100 | #151 | Good 12.0% |
| Immigrants | Korea | 65.5 /100 | #152 | Good 12.0% |
| Immigrants | Turkey | 64.7 /100 | #153 | Good 12.0% |
Demographics Similar to Immigrants from Cambodia by Seniors Poverty Over the Age of 75
In terms of seniors poverty over the age of 75, the demographic groups most similar to Immigrants from Cambodia are Uruguayan (13.5%, a difference of 0.23%), Spanish American (13.5%, a difference of 0.37%), Immigrants from Ukraine (13.6%, a difference of 0.40%), African (13.6%, a difference of 0.43%), and Immigrants from Albania (13.6%, a difference of 0.44%).
| Demographics | Rating | Rank | Seniors Poverty Over the Age of 75 |
| Panamanians | 0.8 /100 | #239 | Tragic 13.4% |
| Argentineans | 0.7 /100 | #240 | Tragic 13.4% |
| Immigrants | Russia | 0.6 /100 | #241 | Tragic 13.4% |
| Immigrants | Somalia | 0.6 /100 | #242 | Tragic 13.5% |
| Dutch West Indians | 0.6 /100 | #243 | Tragic 13.5% |
| Spanish Americans | 0.5 /100 | #244 | Tragic 13.5% |
| Uruguayans | 0.5 /100 | #245 | Tragic 13.5% |
| Immigrants | Cambodia | 0.4 /100 | #246 | Tragic 13.6% |
| Immigrants | Ukraine | 0.3 /100 | #247 | Tragic 13.6% |
| Africans | 0.3 /100 | #248 | Tragic 13.6% |
| Immigrants | Albania | 0.3 /100 | #249 | Tragic 13.6% |
| Mexican American Indians | 0.3 /100 | #250 | Tragic 13.6% |
| Immigrants | Peru | 0.3 /100 | #251 | Tragic 13.7% |
| Immigrants | Argentina | 0.3 /100 | #252 | Tragic 13.7% |
| Immigrants | Spain | 0.2 /100 | #253 | Tragic 13.7% |