Immigrants from South Eastern Asia vs Immigrants from Cambodia Seniors Poverty Over the Age of 75
COMPARE
Immigrants from South Eastern Asia
Immigrants from Cambodia
Seniors Poverty Over the Age of 75
Seniors Poverty Over the Age of 75 Comparison
Immigrants from South Eastern Asia
Immigrants from Cambodia
12.2%
SENIORS POVERTY OVER THE AGE OF 75
44.3/ 100
METRIC RATING
180th/ 347
METRIC RANK
13.6%
SENIORS POVERTY OVER THE AGE OF 75
0.4/ 100
METRIC RATING
246th/ 347
METRIC RANK
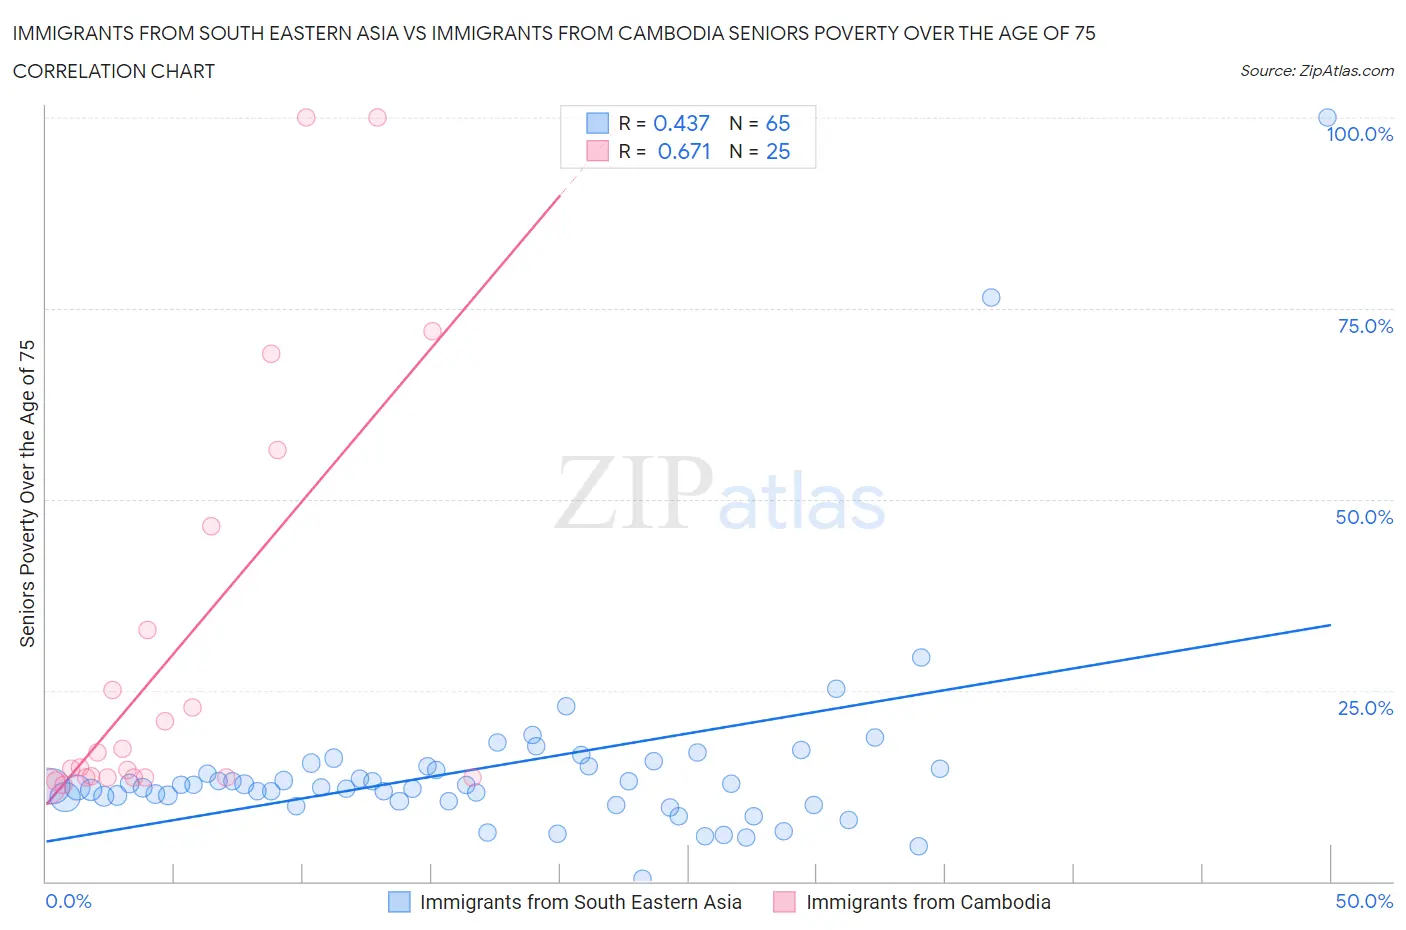
Immigrants from South Eastern Asia vs Immigrants from Cambodia Seniors Poverty Over the Age of 75 Correlation Chart
The statistical analysis conducted on geographies consisting of 503,072,372 people shows a moderate positive correlation between the proportion of Immigrants from South Eastern Asia and poverty level among seniors over the age of 75 in the United States with a correlation coefficient (R) of 0.437 and weighted average of 12.2%. Similarly, the statistical analysis conducted on geographies consisting of 204,192,047 people shows a significant positive correlation between the proportion of Immigrants from Cambodia and poverty level among seniors over the age of 75 in the United States with a correlation coefficient (R) of 0.671 and weighted average of 13.6%, a difference of 10.7%.
Seniors Poverty Over the Age of 75 Correlation Summary
| Measurement | Immigrants from South Eastern Asia | Immigrants from Cambodia |
| Minimum | 0.32% | 12.4% |
| Maximum | 100.0% | 100.0% |
| Range | 99.7% | 87.6% |
| Mean | 14.9% | 30.3% |
| Median | 12.4% | 14.9% |
| Interquartile 25% (IQ1) | 10.4% | 13.6% |
| Interquartile 75% (IQ3) | 15.1% | 39.7% |
| Interquartile Range (IQR) | 4.6% | 26.1% |
| Standard Deviation (Sample) | 14.1% | 27.4% |
| Standard Deviation (Population) | 14.0% | 26.9% |
Similar Demographics by Seniors Poverty Over the Age of 75
Demographics Similar to Immigrants from South Eastern Asia by Seniors Poverty Over the Age of 75
In terms of seniors poverty over the age of 75, the demographic groups most similar to Immigrants from South Eastern Asia are Immigrants from Australia (12.2%, a difference of 0.010%), Mongolian (12.2%, a difference of 0.10%), Nonimmigrants (12.2%, a difference of 0.21%), German Russian (12.3%, a difference of 0.24%), and Immigrants from Asia (12.2%, a difference of 0.29%).
| Demographics | Rating | Rank | Seniors Poverty Over the Age of 75 |
| Arabs | 50.5 /100 | #173 | Average 12.2% |
| Immigrants | Europe | 50.0 /100 | #174 | Average 12.2% |
| Immigrants | Saudi Arabia | 49.5 /100 | #175 | Average 12.2% |
| Immigrants | Iran | 48.1 /100 | #176 | Average 12.2% |
| Immigrants | Asia | 47.8 /100 | #177 | Average 12.2% |
| Immigrants | Nonimmigrants | 46.8 /100 | #178 | Average 12.2% |
| Mongolians | 45.5 /100 | #179 | Average 12.2% |
| Immigrants | South Eastern Asia | 44.3 /100 | #180 | Average 12.2% |
| Immigrants | Australia | 44.2 /100 | #181 | Average 12.2% |
| German Russians | 41.4 /100 | #182 | Average 12.3% |
| Laotians | 38.2 /100 | #183 | Fair 12.3% |
| Kiowa | 36.0 /100 | #184 | Fair 12.3% |
| Immigrants | Malaysia | 35.8 /100 | #185 | Fair 12.3% |
| Sri Lankans | 32.3 /100 | #186 | Fair 12.4% |
| Yaqui | 25.9 /100 | #187 | Fair 12.5% |
Demographics Similar to Immigrants from Cambodia by Seniors Poverty Over the Age of 75
In terms of seniors poverty over the age of 75, the demographic groups most similar to Immigrants from Cambodia are Uruguayan (13.5%, a difference of 0.23%), Spanish American (13.5%, a difference of 0.37%), Immigrants from Ukraine (13.6%, a difference of 0.40%), African (13.6%, a difference of 0.43%), and Immigrants from Albania (13.6%, a difference of 0.44%).
| Demographics | Rating | Rank | Seniors Poverty Over the Age of 75 |
| Panamanians | 0.8 /100 | #239 | Tragic 13.4% |
| Argentineans | 0.7 /100 | #240 | Tragic 13.4% |
| Immigrants | Russia | 0.6 /100 | #241 | Tragic 13.4% |
| Immigrants | Somalia | 0.6 /100 | #242 | Tragic 13.5% |
| Dutch West Indians | 0.6 /100 | #243 | Tragic 13.5% |
| Spanish Americans | 0.5 /100 | #244 | Tragic 13.5% |
| Uruguayans | 0.5 /100 | #245 | Tragic 13.5% |
| Immigrants | Cambodia | 0.4 /100 | #246 | Tragic 13.6% |
| Immigrants | Ukraine | 0.3 /100 | #247 | Tragic 13.6% |
| Africans | 0.3 /100 | #248 | Tragic 13.6% |
| Immigrants | Albania | 0.3 /100 | #249 | Tragic 13.6% |
| Mexican American Indians | 0.3 /100 | #250 | Tragic 13.6% |
| Immigrants | Peru | 0.3 /100 | #251 | Tragic 13.7% |
| Immigrants | Argentina | 0.3 /100 | #252 | Tragic 13.7% |
| Immigrants | Spain | 0.2 /100 | #253 | Tragic 13.7% |