Australian vs Maltese Seniors Poverty Over the Age of 75
COMPARE
Australian
Maltese
Seniors Poverty Over the Age of 75
Seniors Poverty Over the Age of 75 Comparison
Australians
Maltese
11.5%
SENIORS POVERTY OVER THE AGE OF 75
94.6/ 100
METRIC RATING
86th/ 347
METRIC RANK
10.3%
SENIORS POVERTY OVER THE AGE OF 75
100.0/ 100
METRIC RATING
7th/ 347
METRIC RANK
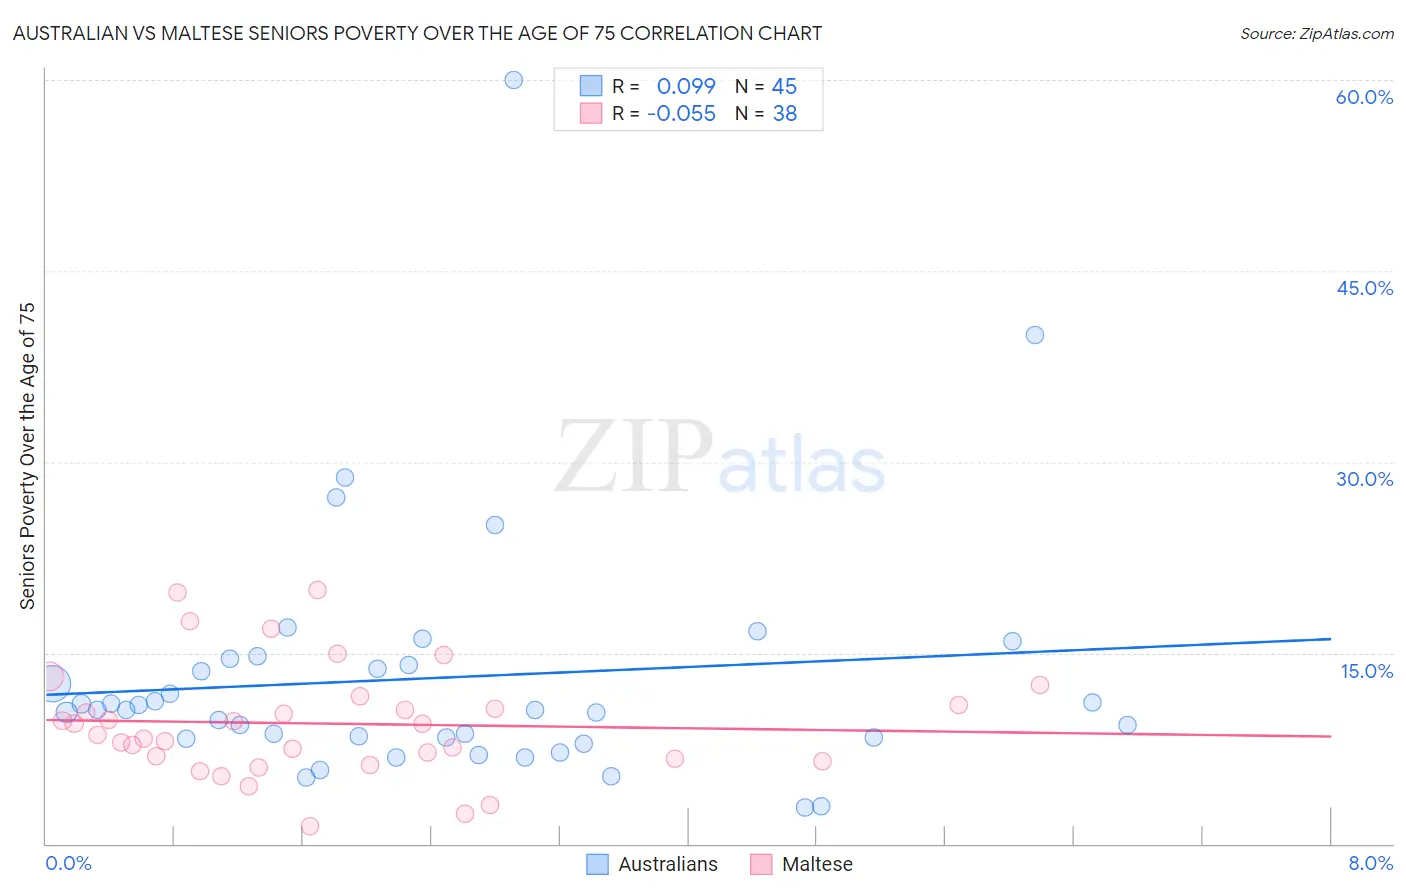
Australian vs Maltese Seniors Poverty Over the Age of 75 Correlation Chart
The statistical analysis conducted on geographies consisting of 222,582,409 people shows a slight positive correlation between the proportion of Australians and poverty level among seniors over the age of 75 in the United States with a correlation coefficient (R) of 0.099 and weighted average of 11.5%. Similarly, the statistical analysis conducted on geographies consisting of 126,057,505 people shows a slight negative correlation between the proportion of Maltese and poverty level among seniors over the age of 75 in the United States with a correlation coefficient (R) of -0.055 and weighted average of 10.3%, a difference of 11.5%.
Seniors Poverty Over the Age of 75 Correlation Summary
| Measurement | Australian | Maltese |
| Minimum | 2.9% | 1.4% |
| Maximum | 60.0% | 19.9% |
| Range | 57.1% | 18.5% |
| Mean | 13.0% | 9.4% |
| Median | 10.5% | 9.0% |
| Interquartile 25% (IQ1) | 8.3% | 6.7% |
| Interquartile 75% (IQ3) | 14.3% | 10.9% |
| Interquartile Range (IQR) | 6.0% | 4.2% |
| Standard Deviation (Sample) | 9.9% | 4.4% |
| Standard Deviation (Population) | 9.8% | 4.3% |
Similar Demographics by Seniors Poverty Over the Age of 75
Demographics Similar to Australians by Seniors Poverty Over the Age of 75
In terms of seniors poverty over the age of 75, the demographic groups most similar to Australians are Immigrants from Bulgaria (11.5%, a difference of 0.020%), Korean (11.5%, a difference of 0.030%), Immigrants from Croatia (11.5%, a difference of 0.050%), Immigrants from Sri Lanka (11.5%, a difference of 0.080%), and Immigrants from Iraq (11.5%, a difference of 0.12%).
| Demographics | Rating | Rank | Seniors Poverty Over the Age of 75 |
| Filipinos | 95.5 /100 | #79 | Exceptional 11.4% |
| Alaska Natives | 95.4 /100 | #80 | Exceptional 11.4% |
| Basques | 95.1 /100 | #81 | Exceptional 11.5% |
| Iranians | 95.1 /100 | #82 | Exceptional 11.5% |
| Immigrants | South Africa | 94.9 /100 | #83 | Exceptional 11.5% |
| Immigrants | Iraq | 94.9 /100 | #84 | Exceptional 11.5% |
| Immigrants | Bulgaria | 94.7 /100 | #85 | Exceptional 11.5% |
| Australians | 94.6 /100 | #86 | Exceptional 11.5% |
| Koreans | 94.5 /100 | #87 | Exceptional 11.5% |
| Immigrants | Croatia | 94.5 /100 | #88 | Exceptional 11.5% |
| Immigrants | Sri Lanka | 94.4 /100 | #89 | Exceptional 11.5% |
| Aleuts | 94.1 /100 | #90 | Exceptional 11.5% |
| Immigrants | Germany | 94.1 /100 | #91 | Exceptional 11.5% |
| Kenyans | 93.9 /100 | #92 | Exceptional 11.5% |
| Immigrants | Poland | 92.9 /100 | #93 | Exceptional 11.6% |
Demographics Similar to Maltese by Seniors Poverty Over the Age of 75
In terms of seniors poverty over the age of 75, the demographic groups most similar to Maltese are German (10.4%, a difference of 0.58%), Danish (10.2%, a difference of 0.65%), Norwegian (10.2%, a difference of 0.92%), English (10.4%, a difference of 0.92%), and Swedish (10.2%, a difference of 1.3%).
| Demographics | Rating | Rank | Seniors Poverty Over the Age of 75 |
| Chinese | 100.0 /100 | #1 | Exceptional 9.1% |
| Tlingit-Haida | 100.0 /100 | #2 | Exceptional 9.7% |
| Native Hawaiians | 100.0 /100 | #3 | Exceptional 10.1% |
| Swedes | 100.0 /100 | #4 | Exceptional 10.2% |
| Norwegians | 100.0 /100 | #5 | Exceptional 10.2% |
| Danes | 100.0 /100 | #6 | Exceptional 10.2% |
| Maltese | 100.0 /100 | #7 | Exceptional 10.3% |
| Germans | 99.9 /100 | #8 | Exceptional 10.4% |
| English | 99.9 /100 | #9 | Exceptional 10.4% |
| Scandinavians | 99.9 /100 | #10 | Exceptional 10.4% |
| Immigrants | India | 99.9 /100 | #11 | Exceptional 10.4% |
| Tongans | 99.9 /100 | #12 | Exceptional 10.5% |
| Croatians | 99.9 /100 | #13 | Exceptional 10.5% |
| Scottish | 99.9 /100 | #14 | Exceptional 10.5% |
| Europeans | 99.9 /100 | #15 | Exceptional 10.5% |