Armenian vs Soviet Union Child Poverty Among Boys Under 16
COMPARE
Armenian
Soviet Union
Child Poverty Among Boys Under 16
Child Poverty Among Boys Under 16 Comparison
Armenians
Soviet Union
15.2%
CHILD POVERTY AMONG BOYS UNDER 16
93.6/ 100
METRIC RATING
115th/ 347
METRIC RANK
14.5%
CHILD POVERTY AMONG BOYS UNDER 16
98.5/ 100
METRIC RATING
65th/ 347
METRIC RANK
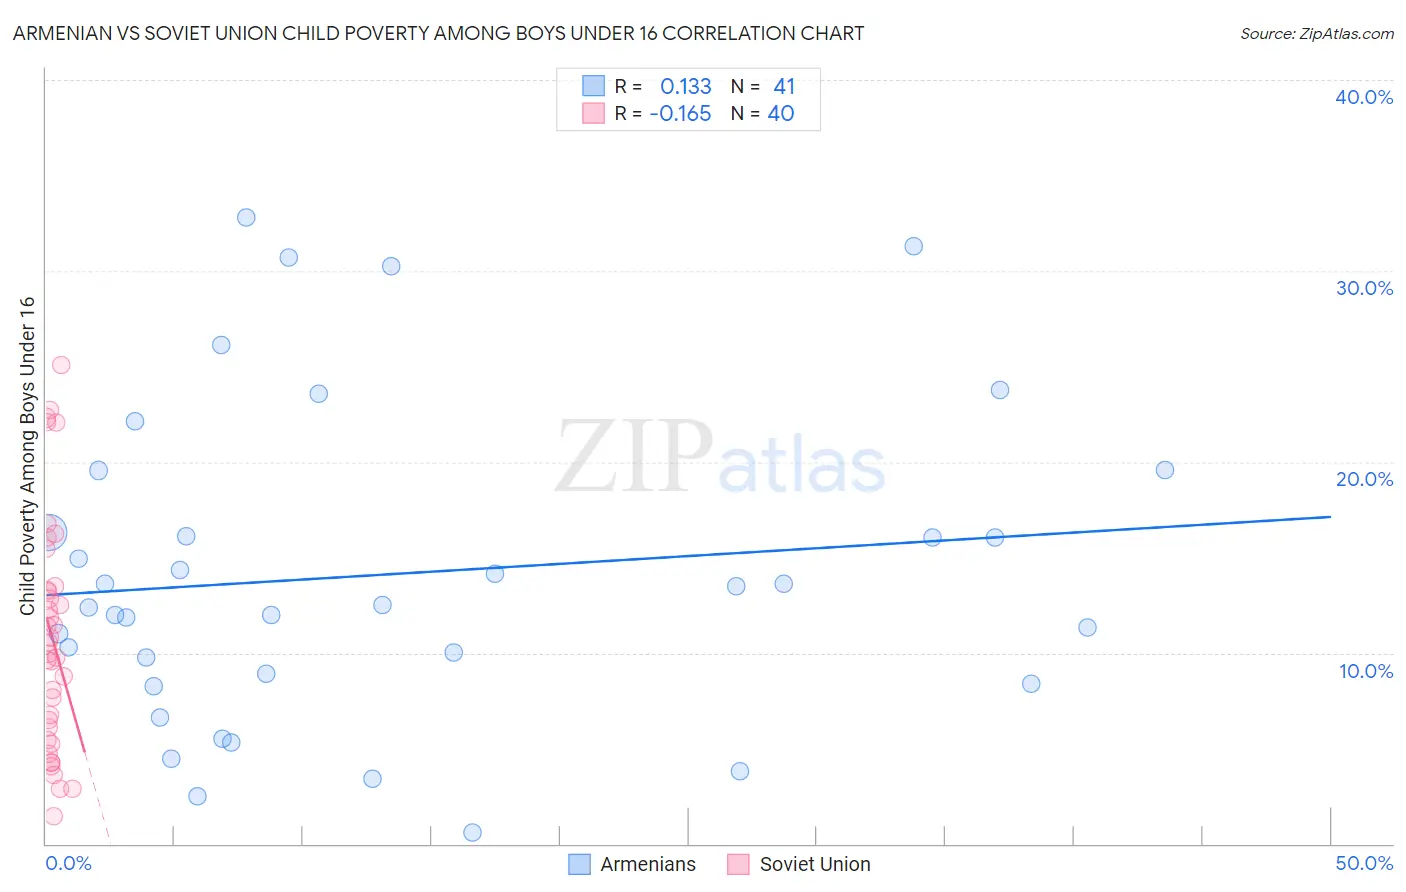
Armenian vs Soviet Union Child Poverty Among Boys Under 16 Correlation Chart
The statistical analysis conducted on geographies consisting of 305,566,477 people shows a poor positive correlation between the proportion of Armenians and poverty level among boys under the age of 16 in the United States with a correlation coefficient (R) of 0.133 and weighted average of 15.2%. Similarly, the statistical analysis conducted on geographies consisting of 43,374,507 people shows a poor negative correlation between the proportion of Soviet Union and poverty level among boys under the age of 16 in the United States with a correlation coefficient (R) of -0.165 and weighted average of 14.5%, a difference of 4.6%.
Child Poverty Among Boys Under 16 Correlation Summary
| Measurement | Armenian | Soviet Union |
| Minimum | 0.62% | 1.4% |
| Maximum | 32.8% | 25.1% |
| Range | 32.2% | 23.7% |
| Mean | 14.1% | 10.8% |
| Median | 12.5% | 10.3% |
| Interquartile 25% (IQ1) | 8.6% | 5.8% |
| Interquartile 75% (IQ3) | 17.9% | 13.4% |
| Interquartile Range (IQR) | 9.3% | 7.6% |
| Standard Deviation (Sample) | 8.2% | 6.1% |
| Standard Deviation (Population) | 8.1% | 6.0% |
Similar Demographics by Child Poverty Among Boys Under 16
Demographics Similar to Armenians by Child Poverty Among Boys Under 16
In terms of child poverty among boys under 16, the demographic groups most similar to Armenians are Immigrants from Ukraine (15.2%, a difference of 0.010%), Immigrants from South Eastern Asia (15.2%, a difference of 0.040%), Irish (15.2%, a difference of 0.070%), Immigrants from Vietnam (15.2%, a difference of 0.070%), and Basque (15.2%, a difference of 0.10%).
| Demographics | Rating | Rank | Child Poverty Among Boys Under 16 |
| Immigrants | England | 94.8 /100 | #108 | Exceptional 15.1% |
| Pakistanis | 94.7 /100 | #109 | Exceptional 15.1% |
| English | 94.3 /100 | #110 | Exceptional 15.1% |
| Immigrants | Zimbabwe | 94.2 /100 | #111 | Exceptional 15.2% |
| Basques | 93.8 /100 | #112 | Exceptional 15.2% |
| Irish | 93.8 /100 | #113 | Exceptional 15.2% |
| Immigrants | Ukraine | 93.6 /100 | #114 | Exceptional 15.2% |
| Armenians | 93.6 /100 | #115 | Exceptional 15.2% |
| Immigrants | South Eastern Asia | 93.5 /100 | #116 | Exceptional 15.2% |
| Immigrants | Vietnam | 93.5 /100 | #117 | Exceptional 15.2% |
| Native Hawaiians | 93.4 /100 | #118 | Exceptional 15.2% |
| Belgians | 93.1 /100 | #119 | Exceptional 15.2% |
| South Africans | 93.0 /100 | #120 | Exceptional 15.2% |
| Scottish | 93.0 /100 | #121 | Exceptional 15.2% |
| Immigrants | Malaysia | 92.8 /100 | #122 | Exceptional 15.3% |
Demographics Similar to Soviet Union by Child Poverty Among Boys Under 16
In terms of child poverty among boys under 16, the demographic groups most similar to Soviet Union are Immigrants from Bulgaria (14.5%, a difference of 0.010%), Immigrants from Romania (14.5%, a difference of 0.030%), Immigrants from Europe (14.5%, a difference of 0.030%), Slovene (14.5%, a difference of 0.12%), and Cambodian (14.5%, a difference of 0.16%).
| Demographics | Rating | Rank | Child Poverty Among Boys Under 16 |
| Immigrants | Sweden | 98.9 /100 | #58 | Exceptional 14.4% |
| Immigrants | Czechoslovakia | 98.9 /100 | #59 | Exceptional 14.4% |
| Immigrants | Belgium | 98.9 /100 | #60 | Exceptional 14.4% |
| Scandinavians | 98.8 /100 | #61 | Exceptional 14.4% |
| Immigrants | Israel | 98.7 /100 | #62 | Exceptional 14.4% |
| Cambodians | 98.5 /100 | #63 | Exceptional 14.5% |
| Immigrants | Romania | 98.5 /100 | #64 | Exceptional 14.5% |
| Soviet Union | 98.5 /100 | #65 | Exceptional 14.5% |
| Immigrants | Bulgaria | 98.5 /100 | #66 | Exceptional 14.5% |
| Immigrants | Europe | 98.4 /100 | #67 | Exceptional 14.5% |
| Slovenes | 98.4 /100 | #68 | Exceptional 14.5% |
| Immigrants | Austria | 98.4 /100 | #69 | Exceptional 14.5% |
| Europeans | 98.4 /100 | #70 | Exceptional 14.5% |
| Immigrants | Netherlands | 98.1 /100 | #71 | Exceptional 14.6% |
| Immigrants | Latvia | 98.1 /100 | #72 | Exceptional 14.6% |