Apache vs Houma Child Poverty Under the Age of 16
COMPARE
Apache
Houma
Child Poverty Under the Age of 16
Child Poverty Under the Age of 16 Comparison
Apache
Houma
23.8%
CHILD POVERTY UNDER THE AGE OF 16
0.0/ 100
METRIC RATING
331st/ 347
METRIC RANK
24.9%
CHILD POVERTY UNDER THE AGE OF 16
0.0/ 100
METRIC RATING
335th/ 347
METRIC RANK
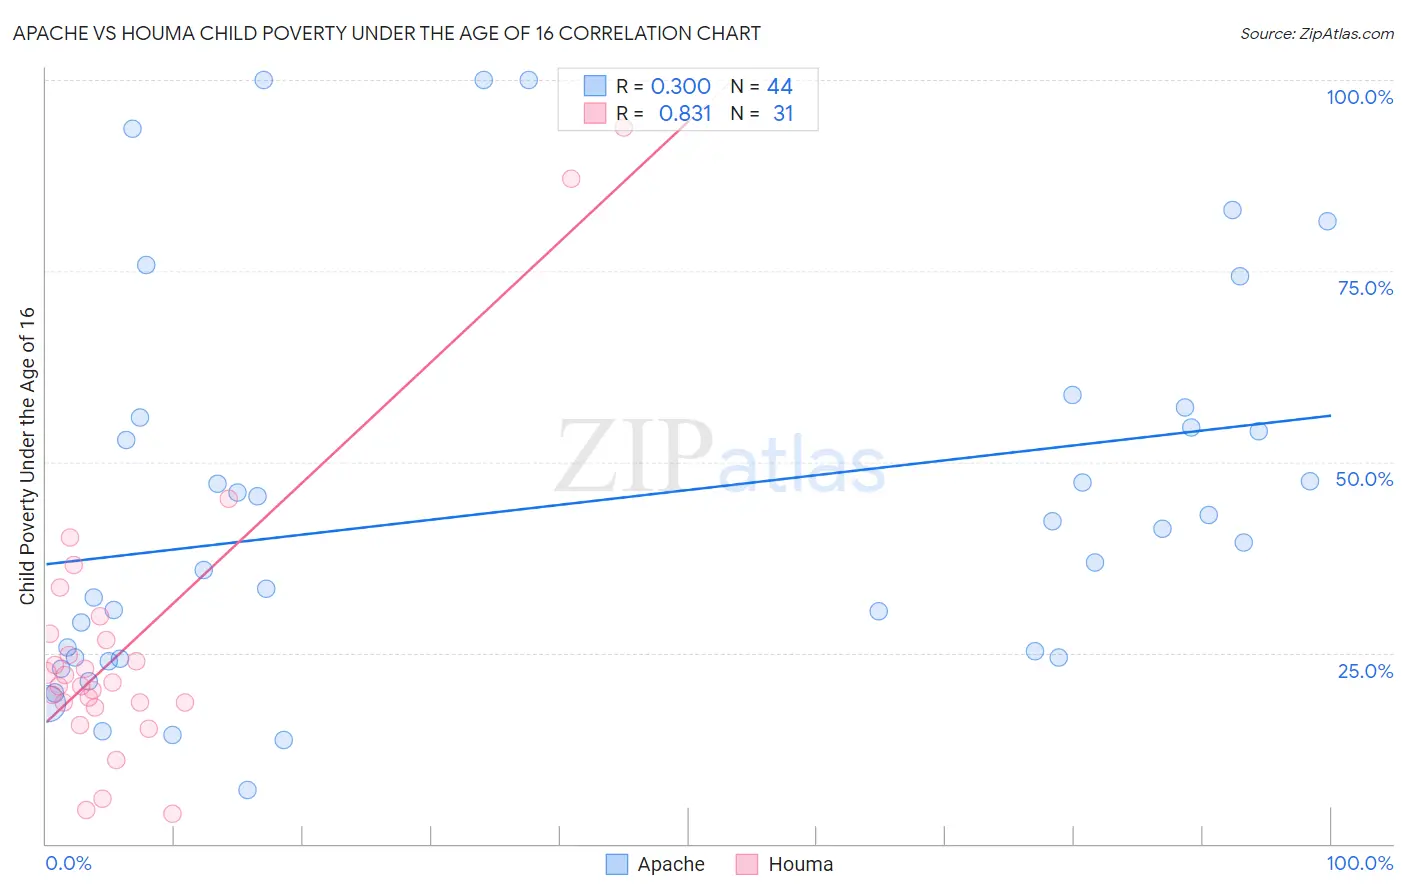
Apache vs Houma Child Poverty Under the Age of 16 Correlation Chart
The statistical analysis conducted on geographies consisting of 230,480,863 people shows a weak positive correlation between the proportion of Apache and poverty level among children under the age of 16 in the United States with a correlation coefficient (R) of 0.300 and weighted average of 23.8%. Similarly, the statistical analysis conducted on geographies consisting of 36,741,016 people shows a very strong positive correlation between the proportion of Houma and poverty level among children under the age of 16 in the United States with a correlation coefficient (R) of 0.831 and weighted average of 24.9%, a difference of 4.3%.
Child Poverty Under the Age of 16 Correlation Summary
| Measurement | Apache | Houma |
| Minimum | 7.0% | 3.9% |
| Maximum | 100.0% | 93.9% |
| Range | 93.0% | 89.9% |
| Mean | 44.3% | 26.1% |
| Median | 40.4% | 21.1% |
| Interquartile 25% (IQ1) | 24.3% | 18.5% |
| Interquartile 75% (IQ3) | 55.2% | 27.6% |
| Interquartile Range (IQR) | 30.9% | 9.1% |
| Standard Deviation (Sample) | 25.1% | 19.5% |
| Standard Deviation (Population) | 24.8% | 19.2% |
Demographics Similar to Apache and Houma by Child Poverty Under the Age of 16
In terms of child poverty under the age of 16, the demographic groups most similar to Apache are Native/Alaskan (23.8%, a difference of 0.22%), Dominican (23.8%, a difference of 0.31%), Pueblo (23.9%, a difference of 0.38%), Immigrants from Dominican Republic (24.0%, a difference of 0.55%), and Black/African American (24.4%, a difference of 2.5%). Similarly, the demographic groups most similar to Houma are Yup'ik (25.1%, a difference of 1.1%), Sioux (25.2%, a difference of 1.4%), Black/African American (24.4%, a difference of 1.7%), Cheyenne (25.4%, a difference of 2.1%), and Immigrants from Dominican Republic (24.0%, a difference of 3.7%).
| Demographics | Rating | Rank | Child Poverty Under the Age of 16 |
| Paiute | 0.0 /100 | #323 | Tragic 22.4% |
| Central American Indians | 0.0 /100 | #324 | Tragic 22.5% |
| Immigrants | Congo | 0.0 /100 | #325 | Tragic 22.5% |
| Immigrants | Honduras | 0.0 /100 | #326 | Tragic 22.7% |
| Menominee | 0.0 /100 | #327 | Tragic 23.0% |
| Colville | 0.0 /100 | #328 | Tragic 23.0% |
| Dominicans | 0.0 /100 | #329 | Tragic 23.8% |
| Natives/Alaskans | 0.0 /100 | #330 | Tragic 23.8% |
| Apache | 0.0 /100 | #331 | Tragic 23.8% |
| Pueblo | 0.0 /100 | #332 | Tragic 23.9% |
| Immigrants | Dominican Republic | 0.0 /100 | #333 | Tragic 24.0% |
| Blacks/African Americans | 0.0 /100 | #334 | Tragic 24.4% |
| Houma | 0.0 /100 | #335 | Tragic 24.9% |
| Yup'ik | 0.0 /100 | #336 | Tragic 25.1% |
| Sioux | 0.0 /100 | #337 | Tragic 25.2% |
| Cheyenne | 0.0 /100 | #338 | Tragic 25.4% |
| Crow | 0.0 /100 | #339 | Tragic 26.0% |
| Hopi | 0.0 /100 | #340 | Tragic 27.1% |
| Yuman | 0.0 /100 | #341 | Tragic 28.9% |
| Pima | 0.0 /100 | #342 | Tragic 29.0% |
| Immigrants | Yemen | 0.0 /100 | #343 | Tragic 29.1% |