Apache vs Creek Child Poverty Under the Age of 16
COMPARE
Apache
Creek
Child Poverty Under the Age of 16
Child Poverty Under the Age of 16 Comparison
Apache
Creek
23.8%
CHILD POVERTY UNDER THE AGE OF 16
0.0/ 100
METRIC RATING
331st/ 347
METRIC RANK
21.5%
CHILD POVERTY UNDER THE AGE OF 16
0.0/ 100
METRIC RATING
313th/ 347
METRIC RANK
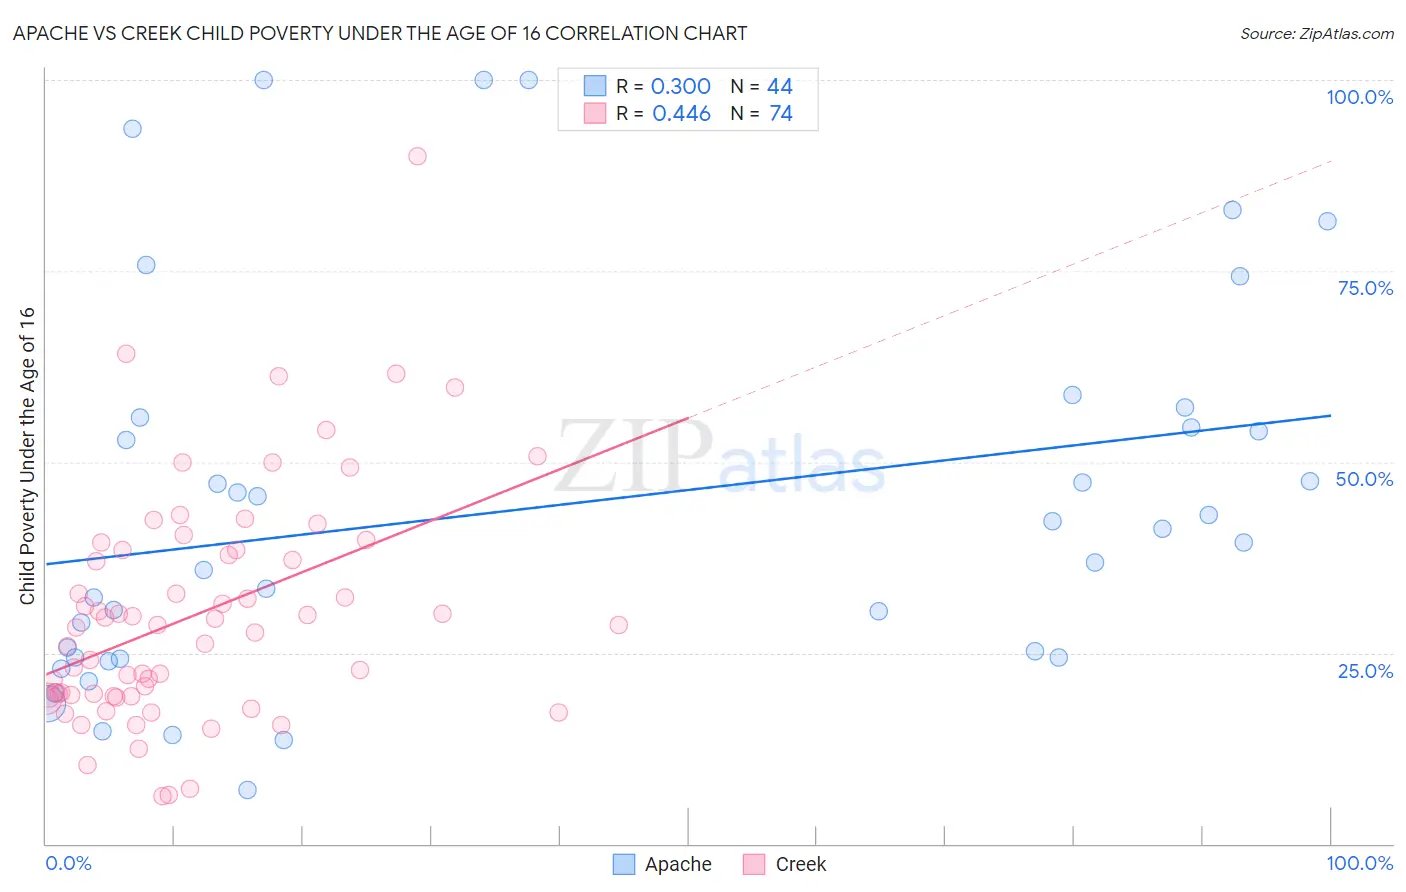
Apache vs Creek Child Poverty Under the Age of 16 Correlation Chart
The statistical analysis conducted on geographies consisting of 230,480,863 people shows a weak positive correlation between the proportion of Apache and poverty level among children under the age of 16 in the United States with a correlation coefficient (R) of 0.300 and weighted average of 23.8%. Similarly, the statistical analysis conducted on geographies consisting of 177,951,590 people shows a moderate positive correlation between the proportion of Creek and poverty level among children under the age of 16 in the United States with a correlation coefficient (R) of 0.446 and weighted average of 21.5%, a difference of 10.7%.
Child Poverty Under the Age of 16 Correlation Summary
| Measurement | Apache | Creek |
| Minimum | 7.0% | 6.3% |
| Maximum | 100.0% | 90.0% |
| Range | 93.0% | 83.7% |
| Mean | 44.3% | 30.0% |
| Median | 40.4% | 28.4% |
| Interquartile 25% (IQ1) | 24.3% | 19.4% |
| Interquartile 75% (IQ3) | 55.2% | 38.4% |
| Interquartile Range (IQR) | 30.9% | 19.0% |
| Standard Deviation (Sample) | 25.1% | 15.2% |
| Standard Deviation (Population) | 24.8% | 15.1% |
Demographics Similar to Apache and Creek by Child Poverty Under the Age of 16
In terms of child poverty under the age of 16, the demographic groups most similar to Apache are Native/Alaskan (23.8%, a difference of 0.22%), Dominican (23.8%, a difference of 0.31%), Pueblo (23.9%, a difference of 0.38%), Colville (23.0%, a difference of 3.4%), and Menominee (23.0%, a difference of 3.8%). Similarly, the demographic groups most similar to Creek are Ute (21.5%, a difference of 0.030%), Immigrants from Somalia (21.6%, a difference of 0.21%), Immigrants from Guatemala (21.6%, a difference of 0.34%), African (21.7%, a difference of 0.76%), and Immigrants from Dominica (21.9%, a difference of 1.5%).
| Demographics | Rating | Rank | Child Poverty Under the Age of 16 |
| Ute | 0.0 /100 | #312 | Tragic 21.5% |
| Creek | 0.0 /100 | #313 | Tragic 21.5% |
| Immigrants | Somalia | 0.0 /100 | #314 | Tragic 21.6% |
| Immigrants | Guatemala | 0.0 /100 | #315 | Tragic 21.6% |
| Africans | 0.0 /100 | #316 | Tragic 21.7% |
| Immigrants | Dominica | 0.0 /100 | #317 | Tragic 21.9% |
| U.S. Virgin Islanders | 0.0 /100 | #318 | Tragic 22.0% |
| Yakama | 0.0 /100 | #319 | Tragic 22.1% |
| Cajuns | 0.0 /100 | #320 | Tragic 22.1% |
| Kiowa | 0.0 /100 | #321 | Tragic 22.2% |
| Hondurans | 0.0 /100 | #322 | Tragic 22.2% |
| Paiute | 0.0 /100 | #323 | Tragic 22.4% |
| Central American Indians | 0.0 /100 | #324 | Tragic 22.5% |
| Immigrants | Congo | 0.0 /100 | #325 | Tragic 22.5% |
| Immigrants | Honduras | 0.0 /100 | #326 | Tragic 22.7% |
| Menominee | 0.0 /100 | #327 | Tragic 23.0% |
| Colville | 0.0 /100 | #328 | Tragic 23.0% |
| Dominicans | 0.0 /100 | #329 | Tragic 23.8% |
| Natives/Alaskans | 0.0 /100 | #330 | Tragic 23.8% |
| Apache | 0.0 /100 | #331 | Tragic 23.8% |
| Pueblo | 0.0 /100 | #332 | Tragic 23.9% |