American vs Immigrants from Dominica Seniors Poverty Over the Age of 75
COMPARE
American
Immigrants from Dominica
Seniors Poverty Over the Age of 75
Seniors Poverty Over the Age of 75 Comparison
Americans
Immigrants from Dominica
12.0%
SENIORS POVERTY OVER THE AGE OF 75
71.0/ 100
METRIC RATING
143rd/ 347
METRIC RANK
17.0%
SENIORS POVERTY OVER THE AGE OF 75
0.0/ 100
METRIC RATING
329th/ 347
METRIC RANK
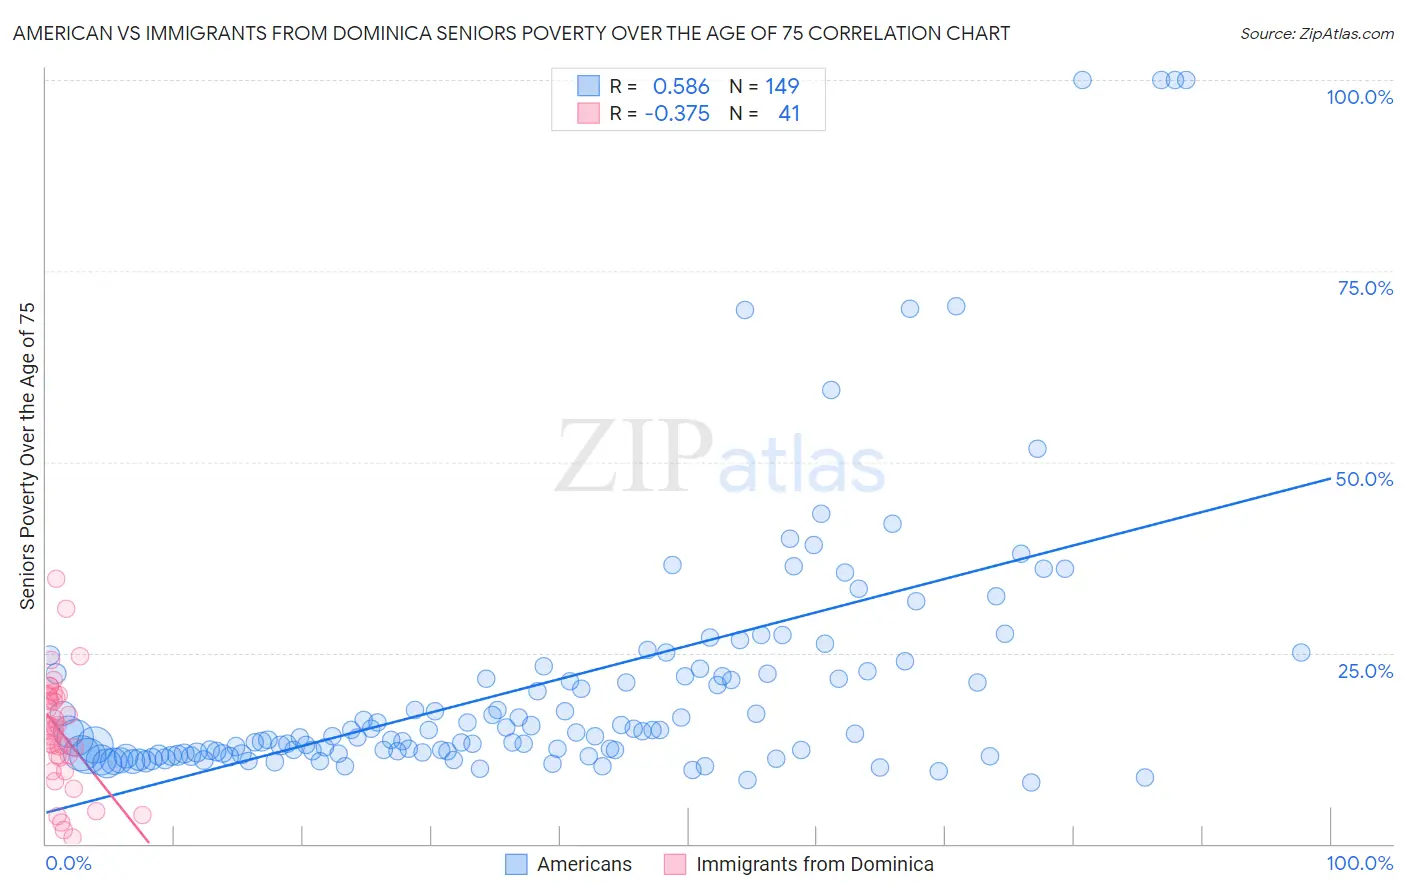
American vs Immigrants from Dominica Seniors Poverty Over the Age of 75 Correlation Chart
The statistical analysis conducted on geographies consisting of 563,023,390 people shows a substantial positive correlation between the proportion of Americans and poverty level among seniors over the age of 75 in the United States with a correlation coefficient (R) of 0.586 and weighted average of 12.0%. Similarly, the statistical analysis conducted on geographies consisting of 83,495,108 people shows a mild negative correlation between the proportion of Immigrants from Dominica and poverty level among seniors over the age of 75 in the United States with a correlation coefficient (R) of -0.375 and weighted average of 17.0%, a difference of 42.1%.
Seniors Poverty Over the Age of 75 Correlation Summary
| Measurement | American | Immigrants from Dominica |
| Minimum | 8.0% | 0.80% |
| Maximum | 100.0% | 34.8% |
| Range | 92.0% | 34.0% |
| Mean | 20.9% | 14.7% |
| Median | 14.1% | 15.1% |
| Interquartile 25% (IQ1) | 11.8% | 10.4% |
| Interquartile 75% (IQ3) | 22.3% | 19.3% |
| Interquartile Range (IQR) | 10.5% | 8.9% |
| Standard Deviation (Sample) | 17.6% | 7.4% |
| Standard Deviation (Population) | 17.5% | 7.3% |
Similar Demographics by Seniors Poverty Over the Age of 75
Demographics Similar to Americans by Seniors Poverty Over the Age of 75
In terms of seniors poverty over the age of 75, the demographic groups most similar to Americans are Hmong (12.0%, a difference of 0.010%), Immigrants from Belgium (12.0%, a difference of 0.010%), Immigrants from Laos (12.0%, a difference of 0.050%), Bangladeshi (12.0%, a difference of 0.060%), and Immigrants from Cameroon (12.0%, a difference of 0.080%).
| Demographics | Rating | Rank | Seniors Poverty Over the Age of 75 |
| Immigrants | Philippines | 75.0 /100 | #136 | Good 11.9% |
| Immigrants | Moldova | 74.1 /100 | #137 | Good 11.9% |
| Immigrants | Romania | 72.6 /100 | #138 | Good 11.9% |
| Immigrants | Kenya | 72.6 /100 | #139 | Good 11.9% |
| Immigrants | Pakistan | 71.9 /100 | #140 | Good 12.0% |
| Immigrants | Cameroon | 71.7 /100 | #141 | Good 12.0% |
| Immigrants | Laos | 71.5 /100 | #142 | Good 12.0% |
| Americans | 71.0 /100 | #143 | Good 12.0% |
| Hmong | 70.8 /100 | #144 | Good 12.0% |
| Immigrants | Belgium | 70.8 /100 | #145 | Good 12.0% |
| Bangladeshis | 70.4 /100 | #146 | Good 12.0% |
| Immigrants | Latvia | 69.1 /100 | #147 | Good 12.0% |
| Immigrants | Zaire | 67.6 /100 | #148 | Good 12.0% |
| Asians | 67.4 /100 | #149 | Good 12.0% |
| Cypriots | 67.3 /100 | #150 | Good 12.0% |
Demographics Similar to Immigrants from Dominica by Seniors Poverty Over the Age of 75
In terms of seniors poverty over the age of 75, the demographic groups most similar to Immigrants from Dominica are Cape Verdean (16.8%, a difference of 1.4%), Sioux (16.8%, a difference of 1.4%), Pueblo (16.7%, a difference of 1.7%), Nicaraguan (16.6%, a difference of 2.4%), and British West Indian (17.4%, a difference of 2.4%).
| Demographics | Rating | Rank | Seniors Poverty Over the Age of 75 |
| Immigrants | Barbados | 0.0 /100 | #322 | Tragic 16.5% |
| Central American Indians | 0.0 /100 | #323 | Tragic 16.5% |
| Immigrants | Uzbekistan | 0.0 /100 | #324 | Tragic 16.5% |
| Nicaraguans | 0.0 /100 | #325 | Tragic 16.6% |
| Pueblo | 0.0 /100 | #326 | Tragic 16.7% |
| Sioux | 0.0 /100 | #327 | Tragic 16.8% |
| Cape Verdeans | 0.0 /100 | #328 | Tragic 16.8% |
| Immigrants | Dominica | 0.0 /100 | #329 | Tragic 17.0% |
| British West Indians | 0.0 /100 | #330 | Tragic 17.4% |
| Immigrants | Armenia | 0.0 /100 | #331 | Tragic 17.5% |
| Immigrants | St. Vincent and the Grenadines | 0.0 /100 | #332 | Tragic 17.5% |
| Immigrants | Nicaragua | 0.0 /100 | #333 | Tragic 17.6% |
| Immigrants | Grenada | 0.0 /100 | #334 | Tragic 17.8% |
| Cubans | 0.0 /100 | #335 | Tragic 18.0% |
| Immigrants | Caribbean | 0.0 /100 | #336 | Tragic 18.2% |