Immigrants from Eastern Africa vs Sudanese Child Poverty Under the Age of 16
COMPARE
Immigrants from Eastern Africa
Sudanese
Child Poverty Under the Age of 16
Child Poverty Under the Age of 16 Comparison
Immigrants from Eastern Africa
Sudanese
17.6%
CHILD POVERTY UNDER THE AGE OF 16
5.3/ 100
METRIC RATING
217th/ 347
METRIC RANK
18.5%
CHILD POVERTY UNDER THE AGE OF 16
0.9/ 100
METRIC RATING
237th/ 347
METRIC RANK
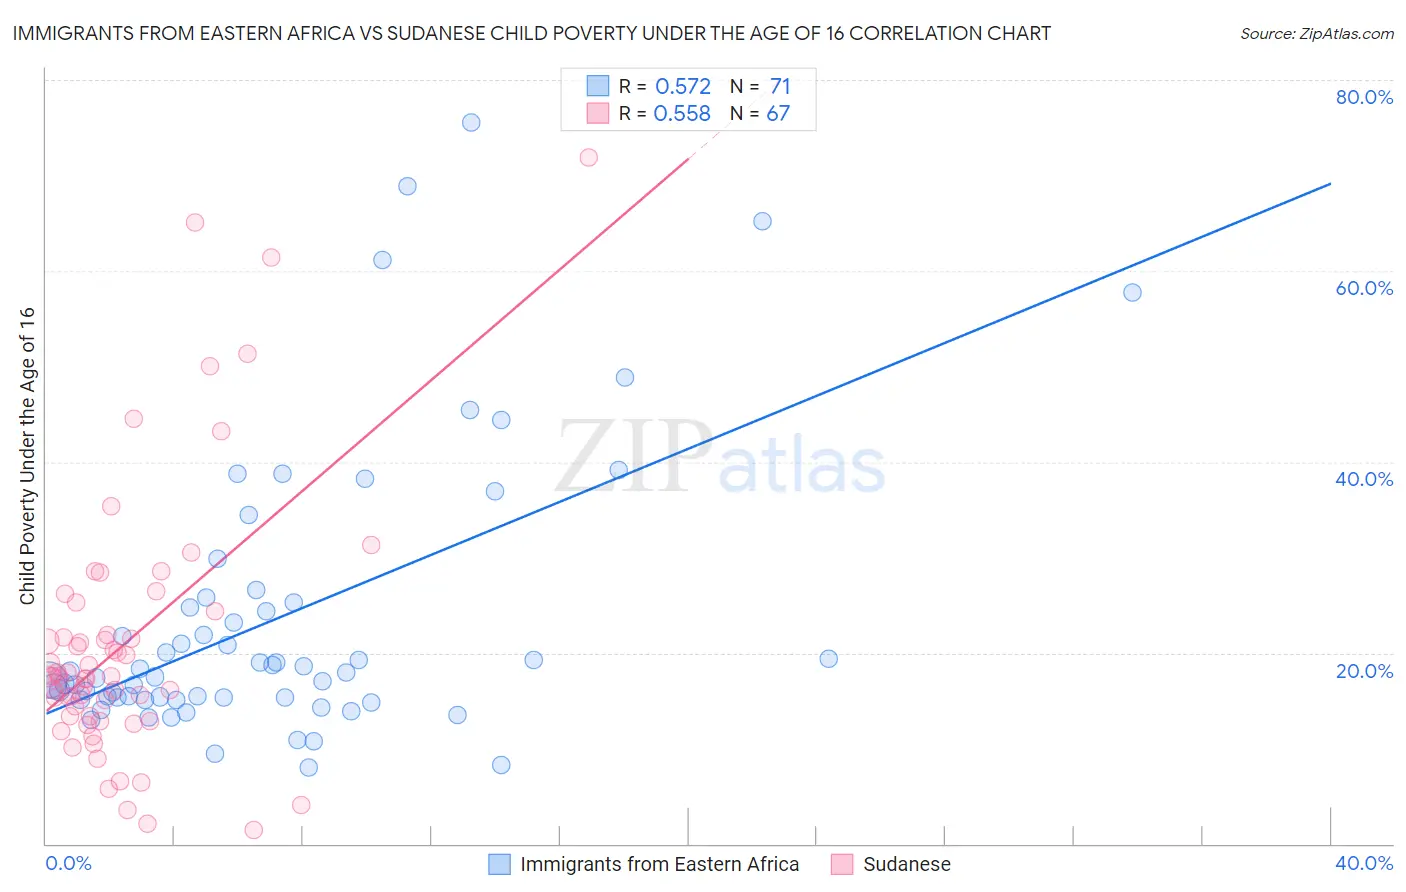
Immigrants from Eastern Africa vs Sudanese Child Poverty Under the Age of 16 Correlation Chart
The statistical analysis conducted on geographies consisting of 352,909,115 people shows a substantial positive correlation between the proportion of Immigrants from Eastern Africa and poverty level among children under the age of 16 in the United States with a correlation coefficient (R) of 0.572 and weighted average of 17.6%. Similarly, the statistical analysis conducted on geographies consisting of 109,977,146 people shows a substantial positive correlation between the proportion of Sudanese and poverty level among children under the age of 16 in the United States with a correlation coefficient (R) of 0.558 and weighted average of 18.5%, a difference of 5.1%.
Child Poverty Under the Age of 16 Correlation Summary
| Measurement | Immigrants from Eastern Africa | Sudanese |
| Minimum | 8.0% | 1.5% |
| Maximum | 75.6% | 71.9% |
| Range | 67.6% | 70.4% |
| Mean | 23.6% | 21.0% |
| Median | 17.9% | 17.5% |
| Interquartile 25% (IQ1) | 15.3% | 13.3% |
| Interquartile 75% (IQ3) | 25.2% | 24.4% |
| Interquartile Range (IQR) | 9.9% | 11.1% |
| Standard Deviation (Sample) | 14.8% | 14.0% |
| Standard Deviation (Population) | 14.7% | 13.9% |
Demographics Similar to Immigrants from Eastern Africa and Sudanese by Child Poverty Under the Age of 16
In terms of child poverty under the age of 16, the demographic groups most similar to Immigrants from Eastern Africa are Moroccan (17.6%, a difference of 0.010%), Japanese (17.7%, a difference of 0.37%), Immigrants from Panama (17.7%, a difference of 0.78%), Cuban (17.8%, a difference of 1.1%), and Immigrants from Armenia (17.8%, a difference of 1.1%). Similarly, the demographic groups most similar to Sudanese are Cree (18.5%, a difference of 0.030%), Nigerian (18.4%, a difference of 0.32%), Immigrants from Nigeria (18.4%, a difference of 0.38%), Fijian (18.4%, a difference of 0.63%), and American (18.3%, a difference of 0.85%).
| Demographics | Rating | Rank | Child Poverty Under the Age of 16 |
| Immigrants | Eastern Africa | 5.3 /100 | #217 | Tragic 17.6% |
| Moroccans | 5.3 /100 | #218 | Tragic 17.6% |
| Japanese | 4.7 /100 | #219 | Tragic 17.7% |
| Immigrants | Panama | 4.1 /100 | #220 | Tragic 17.7% |
| Cubans | 3.7 /100 | #221 | Tragic 17.8% |
| Immigrants | Armenia | 3.6 /100 | #222 | Tragic 17.8% |
| Immigrants | Cambodia | 3.3 /100 | #223 | Tragic 17.8% |
| Osage | 3.1 /100 | #224 | Tragic 17.9% |
| Immigrants | Nonimmigrants | 2.7 /100 | #225 | Tragic 17.9% |
| Bermudans | 2.6 /100 | #226 | Tragic 18.0% |
| Immigrants | Africa | 2.5 /100 | #227 | Tragic 18.0% |
| Immigrants | Micronesia | 2.3 /100 | #228 | Tragic 18.0% |
| Marshallese | 1.8 /100 | #229 | Tragic 18.1% |
| Nepalese | 1.7 /100 | #230 | Tragic 18.2% |
| Nicaraguans | 1.7 /100 | #231 | Tragic 18.2% |
| Americans | 1.2 /100 | #232 | Tragic 18.3% |
| Fijians | 1.1 /100 | #233 | Tragic 18.4% |
| Immigrants | Nigeria | 1.0 /100 | #234 | Tragic 18.4% |
| Nigerians | 1.0 /100 | #235 | Tragic 18.4% |
| Cree | 0.9 /100 | #236 | Tragic 18.5% |
| Sudanese | 0.9 /100 | #237 | Tragic 18.5% |