French American Indian vs Ukrainian Child Poverty Among Boys Under 16
COMPARE
French American Indian
Ukrainian
Child Poverty Among Boys Under 16
Child Poverty Among Boys Under 16 Comparison
French American Indians
Ukrainians
19.2%
CHILD POVERTY AMONG BOYS UNDER 16
0.2/ 100
METRIC RATING
251st/ 347
METRIC RANK
14.7%
CHILD POVERTY AMONG BOYS UNDER 16
97.6/ 100
METRIC RATING
82nd/ 347
METRIC RANK
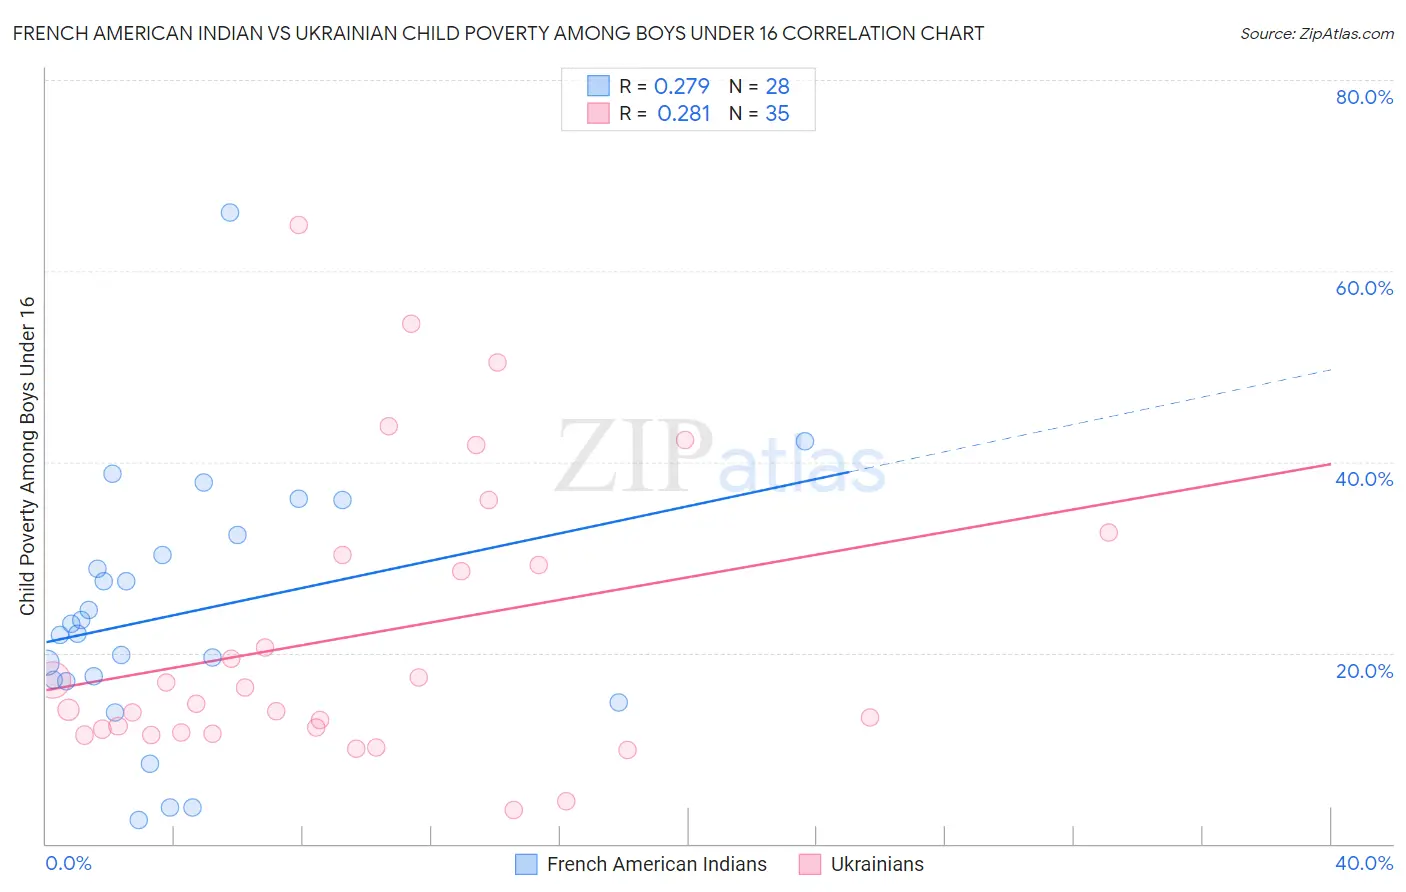
French American Indian vs Ukrainian Child Poverty Among Boys Under 16 Correlation Chart
The statistical analysis conducted on geographies consisting of 131,081,352 people shows a weak positive correlation between the proportion of French American Indians and poverty level among boys under the age of 16 in the United States with a correlation coefficient (R) of 0.279 and weighted average of 19.2%. Similarly, the statistical analysis conducted on geographies consisting of 436,859,544 people shows a weak positive correlation between the proportion of Ukrainians and poverty level among boys under the age of 16 in the United States with a correlation coefficient (R) of 0.281 and weighted average of 14.7%, a difference of 30.4%.
Child Poverty Among Boys Under 16 Correlation Summary
| Measurement | French American Indian | Ukrainian |
| Minimum | 2.5% | 3.5% |
| Maximum | 66.1% | 64.8% |
| Range | 63.6% | 61.3% |
| Mean | 24.1% | 21.8% |
| Median | 22.5% | 14.7% |
| Interquartile 25% (IQ1) | 17.1% | 11.7% |
| Interquartile 75% (IQ3) | 31.3% | 30.2% |
| Interquartile Range (IQR) | 14.2% | 18.5% |
| Standard Deviation (Sample) | 13.4% | 15.1% |
| Standard Deviation (Population) | 13.2% | 14.9% |
Similar Demographics by Child Poverty Among Boys Under 16
Demographics Similar to French American Indians by Child Poverty Among Boys Under 16
In terms of child poverty among boys under 16, the demographic groups most similar to French American Indians are Immigrants from Burma/Myanmar (19.2%, a difference of 0.030%), Immigrants from Western Africa (19.3%, a difference of 0.23%), Liberian (19.3%, a difference of 0.30%), Trinidadian and Tobagonian (19.3%, a difference of 0.57%), and Ecuadorian (19.3%, a difference of 0.57%).
| Demographics | Rating | Rank | Child Poverty Among Boys Under 16 |
| Immigrants | Middle Africa | 0.4 /100 | #244 | Tragic 18.9% |
| Cree | 0.4 /100 | #245 | Tragic 19.0% |
| Immigrants | Nicaragua | 0.4 /100 | #246 | Tragic 19.0% |
| Immigrants | Trinidad and Tobago | 0.3 /100 | #247 | Tragic 19.0% |
| Salvadorans | 0.3 /100 | #248 | Tragic 19.0% |
| Alsatians | 0.3 /100 | #249 | Tragic 19.1% |
| Immigrants | Burma/Myanmar | 0.2 /100 | #250 | Tragic 19.2% |
| French American Indians | 0.2 /100 | #251 | Tragic 19.2% |
| Immigrants | Western Africa | 0.2 /100 | #252 | Tragic 19.3% |
| Liberians | 0.2 /100 | #253 | Tragic 19.3% |
| Trinidadians and Tobagonians | 0.2 /100 | #254 | Tragic 19.3% |
| Ecuadorians | 0.2 /100 | #255 | Tragic 19.3% |
| Immigrants | Liberia | 0.2 /100 | #256 | Tragic 19.3% |
| Mexican American Indians | 0.2 /100 | #257 | Tragic 19.4% |
| Potawatomi | 0.2 /100 | #258 | Tragic 19.4% |
Demographics Similar to Ukrainians by Child Poverty Among Boys Under 16
In terms of child poverty among boys under 16, the demographic groups most similar to Ukrainians are Immigrants from Canada (14.7%, a difference of 0.020%), Immigrants from Russia (14.7%, a difference of 0.16%), Immigrants from South Africa (14.8%, a difference of 0.23%), Immigrants from Eastern Europe (14.7%, a difference of 0.24%), and Egyptian (14.7%, a difference of 0.35%).
| Demographics | Rating | Rank | Child Poverty Among Boys Under 16 |
| Immigrants | Poland | 97.9 /100 | #75 | Exceptional 14.7% |
| Immigrants | Croatia | 97.9 /100 | #76 | Exceptional 14.7% |
| Macedonians | 97.9 /100 | #77 | Exceptional 14.7% |
| Egyptians | 97.8 /100 | #78 | Exceptional 14.7% |
| Immigrants | Eastern Europe | 97.8 /100 | #79 | Exceptional 14.7% |
| Immigrants | Russia | 97.7 /100 | #80 | Exceptional 14.7% |
| Immigrants | Canada | 97.6 /100 | #81 | Exceptional 14.7% |
| Ukrainians | 97.6 /100 | #82 | Exceptional 14.7% |
| Immigrants | South Africa | 97.4 /100 | #83 | Exceptional 14.8% |
| Swiss | 97.3 /100 | #84 | Exceptional 14.8% |
| Taiwanese | 97.3 /100 | #85 | Exceptional 14.8% |
| Germans | 97.2 /100 | #86 | Exceptional 14.8% |
| Northern Europeans | 97.2 /100 | #87 | Exceptional 14.8% |
| Immigrants | North America | 97.1 /100 | #88 | Exceptional 14.8% |
| Immigrants | Argentina | 97.1 /100 | #89 | Exceptional 14.8% |