Immigrants from Turkey vs Immigrants from Northern Europe Female Poverty Among 25-34 Year Olds
COMPARE
Immigrants from Turkey
Immigrants from Northern Europe
Female Poverty Among 25-34 Year Olds
Female Poverty Among 25-34 Year Olds Comparison
Immigrants from Turkey
Immigrants from Northern Europe
11.9%
FEMALE POVERTY AMONG 25-34 YEAR OLDS
99.7/ 100
METRIC RATING
42nd/ 347
METRIC RANK
12.1%
FEMALE POVERTY AMONG 25-34 YEAR OLDS
99.4/ 100
METRIC RATING
60th/ 347
METRIC RANK
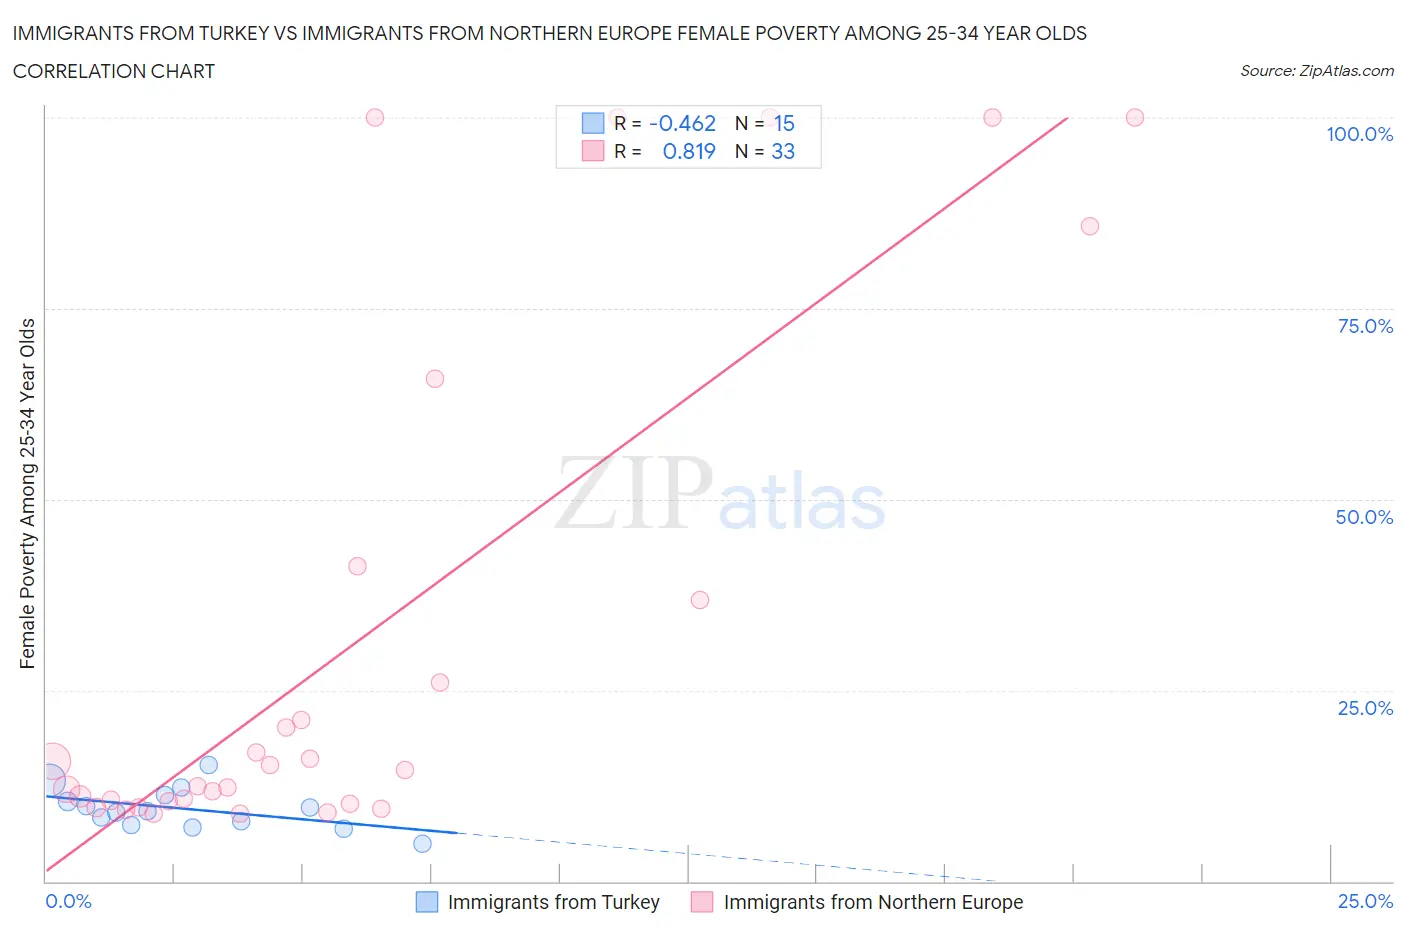
Immigrants from Turkey vs Immigrants from Northern Europe Female Poverty Among 25-34 Year Olds Correlation Chart
The statistical analysis conducted on geographies consisting of 220,548,075 people shows a moderate negative correlation between the proportion of Immigrants from Turkey and poverty level among females between the ages 25 and 34 in the United States with a correlation coefficient (R) of -0.462 and weighted average of 11.9%. Similarly, the statistical analysis conducted on geographies consisting of 464,819,833 people shows a very strong positive correlation between the proportion of Immigrants from Northern Europe and poverty level among females between the ages 25 and 34 in the United States with a correlation coefficient (R) of 0.819 and weighted average of 12.1%, a difference of 1.9%.
Female Poverty Among 25-34 Year Olds Correlation Summary
| Measurement | Immigrants from Turkey | Immigrants from Northern Europe |
| Minimum | 4.9% | 8.8% |
| Maximum | 15.3% | 100.0% |
| Range | 10.3% | 91.2% |
| Mean | 9.5% | 31.6% |
| Median | 9.1% | 14.5% |
| Interquartile 25% (IQ1) | 7.3% | 10.3% |
| Interquartile 75% (IQ3) | 11.3% | 39.0% |
| Interquartile Range (IQR) | 4.0% | 28.7% |
| Standard Deviation (Sample) | 2.7% | 33.7% |
| Standard Deviation (Population) | 2.6% | 33.2% |
Demographics Similar to Immigrants from Turkey and Immigrants from Northern Europe by Female Poverty Among 25-34 Year Olds
In terms of female poverty among 25-34 year olds, the demographic groups most similar to Immigrants from Turkey are Egyptian (11.9%, a difference of 0.25%), Immigrants from Australia (11.9%, a difference of 0.26%), Immigrants from Indonesia (11.8%, a difference of 0.30%), Macedonian (11.9%, a difference of 0.53%), and Immigrants from Serbia (11.9%, a difference of 0.54%). Similarly, the demographic groups most similar to Immigrants from Northern Europe are Immigrants from Czechoslovakia (12.1%, a difference of 0.020%), Immigrants from Romania (12.1%, a difference of 0.090%), Russian (12.1%, a difference of 0.090%), Jordanian (12.1%, a difference of 0.29%), and Luxembourger (12.1%, a difference of 0.31%).
| Demographics | Rating | Rank | Female Poverty Among 25-34 Year Olds |
| Immigrants | Indonesia | 99.8 /100 | #41 | Exceptional 11.8% |
| Immigrants | Turkey | 99.7 /100 | #42 | Exceptional 11.9% |
| Egyptians | 99.7 /100 | #43 | Exceptional 11.9% |
| Immigrants | Australia | 99.7 /100 | #44 | Exceptional 11.9% |
| Macedonians | 99.7 /100 | #45 | Exceptional 11.9% |
| Immigrants | Serbia | 99.7 /100 | #46 | Exceptional 11.9% |
| Koreans | 99.6 /100 | #47 | Exceptional 12.0% |
| Immigrants | Belarus | 99.6 /100 | #48 | Exceptional 12.0% |
| Immigrants | Egypt | 99.6 /100 | #49 | Exceptional 12.0% |
| Immigrants | Croatia | 99.6 /100 | #50 | Exceptional 12.0% |
| Paraguayans | 99.6 /100 | #51 | Exceptional 12.0% |
| Immigrants | Eastern Europe | 99.6 /100 | #52 | Exceptional 12.0% |
| Immigrants | Israel | 99.6 /100 | #53 | Exceptional 12.0% |
| Eastern Europeans | 99.6 /100 | #54 | Exceptional 12.0% |
| Immigrants | Philippines | 99.5 /100 | #55 | Exceptional 12.0% |
| Luxembourgers | 99.5 /100 | #56 | Exceptional 12.1% |
| Jordanians | 99.4 /100 | #57 | Exceptional 12.1% |
| Immigrants | Romania | 99.4 /100 | #58 | Exceptional 12.1% |
| Russians | 99.4 /100 | #59 | Exceptional 12.1% |
| Immigrants | Northern Europe | 99.4 /100 | #60 | Exceptional 12.1% |
| Immigrants | Czechoslovakia | 99.4 /100 | #61 | Exceptional 12.1% |