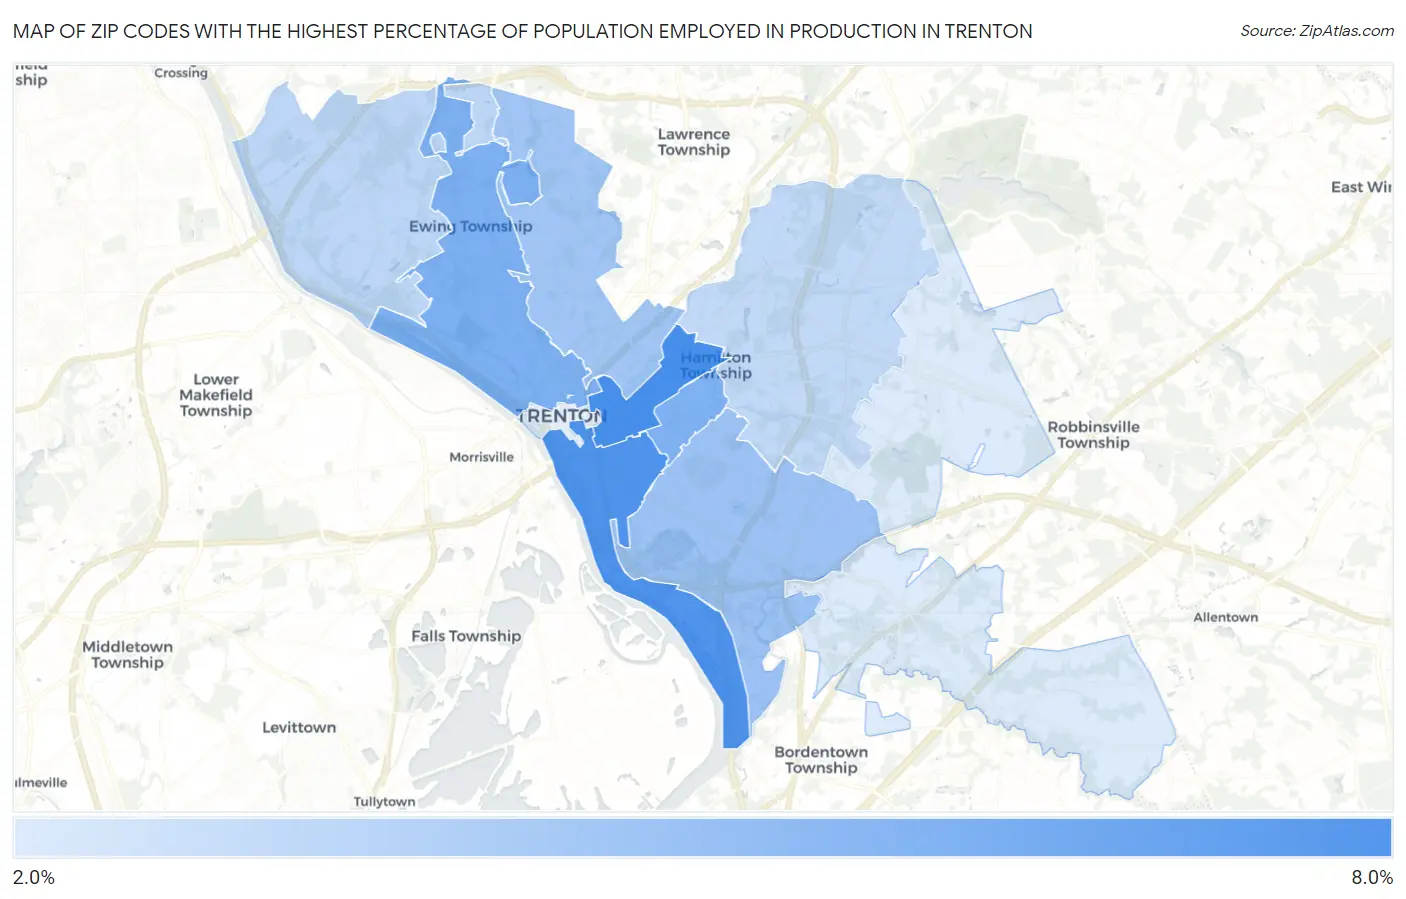
Zip Codes with the Highest Percentage of Population Employed in Production in Trenton, NJ
RELATED REPORTS & OPTIONS
Production
Trenton
Compare Zip Codes
Map of Zip Codes with the Highest Percentage of Population Employed in Production in Trenton
2.2%
7.9%
Zip Codes with the Highest Percentage of Population Employed in Production in Trenton, NJ
| Zip Code | % Employed | vs State | vs National | |
| 1. | 08609 | 7.9% | 3.8%(+4.09)#40 | 5.5%(+2.43)#11,198 |
| 2. | 08611 | 7.6% | 3.8%(+3.80)#45 | 5.5%(+2.15)#11,732 |
| 3. | 08618 | 5.9% | 3.8%(+2.06)#90 | 5.5%(+0.412)#15,504 |
| 4. | 08629 | 5.8% | 3.8%(+1.94)#99 | 5.5%(+0.285)#15,801 |
| 5. | 08610 | 4.7% | 3.8%(+0.881)#148 | 5.5%(-0.771)#18,447 |
| 6. | 08638 | 4.4% | 3.8%(+0.584)#166 | 5.5%(-1.07)#19,267 |
| 7. | 08628 | 3.4% | 3.8%(-0.411)#232 | 5.5%(-2.06)#21,960 |
| 8. | 08619 | 3.2% | 3.8%(-0.655)#254 | 5.5%(-2.31)#22,620 |
| 9. | 08620 | 2.2% | 3.8%(-1.64)#366 | 5.5%(-3.29)#25,342 |
| 10. | 08690 | 2.2% | 3.8%(-1.65)#369 | 5.5%(-3.30)#25,371 |
1
Common Questions
What are the Top 10 Zip Codes with the Highest Percentage of Population Employed in Production in Trenton, NJ?
Top 10 Zip Codes with the Highest Percentage of Population Employed in Production in Trenton, NJ are:
What zip code has the Highest Percentage of Population Employed in Production in Trenton, NJ?
08609 has the Highest Percentage of Population Employed in Production in Trenton, NJ with 7.9%.
What is the Percentage of Population Employed in Production in Trenton, NJ?
Percentage of Population Employed in Production in Trenton is 6.9%.
What is the Percentage of Population Employed in Production in New Jersey?
Percentage of Population Employed in Production in New Jersey is 3.8%.
What is the Percentage of Population Employed in Production in the United States?
Percentage of Population Employed in Production in the United States is 5.5%.