Zip Codes with the Highest Percentage of Renter-Occupied Units in Tupelo, MS
RELATED REPORTS & OPTIONS
Highest Renter-Occupied
Tupelo
Compare Zip Codes
Map of Zip Codes with the Highest Percentage of Renter-Occupied Units in Tupelo
37.2%
37.2%
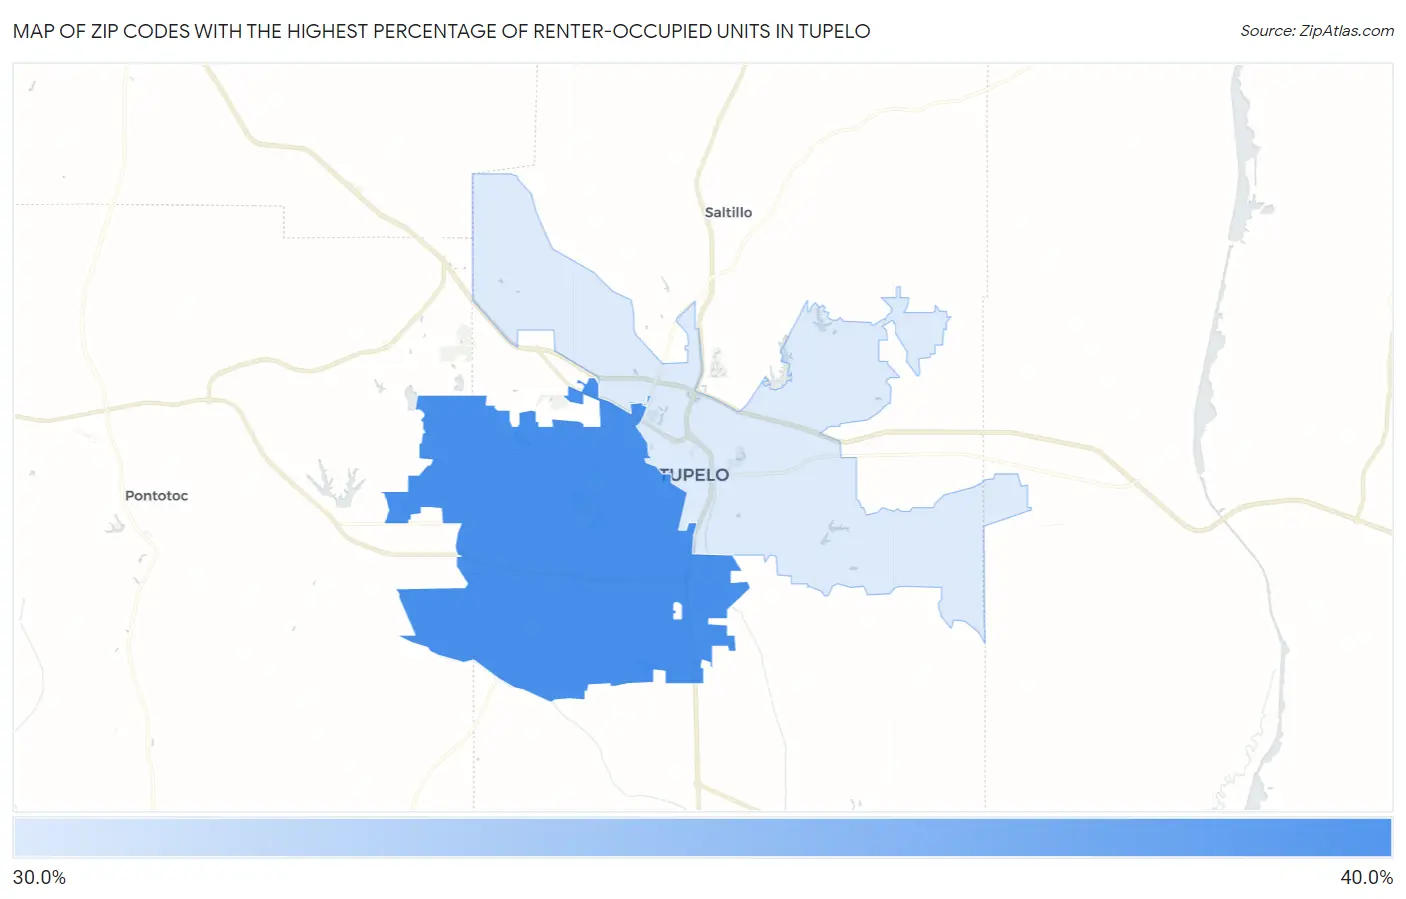
Zip Codes with the Highest Percentage of Renter-Occupied Units in Tupelo, MS
| Zip Code | % Renter-Occupied | vs State | vs National | |
| 1. | 38801 | 37.2% | 30.8%(+6.39)#99 | 35.2%(+2.05)#6,374 |
| 2. | 38804 | 37.2% | 30.8%(+6.37)#100 | 35.2%(+2.02)#6,384 |
1
Common Questions
What are the Top Zip Codes with the Highest Percentage of Renter-Occupied Units in Tupelo, MS?
Top Zip Codes with the Highest Percentage of Renter-Occupied Units in Tupelo, MS are:
What zip code has the Highest Percentage of Renter-Occupied Units in Tupelo, MS?
38801 has the Highest Percentage of Renter-Occupied Units in Tupelo, MS with 37.2%.
What is the Percentage of Renter-Occupied Units in Tupelo, MS?
Percentage of Renter-Occupied Units in Tupelo is 38.1%.
What is the Percentage of Renter-Occupied Units in Mississippi?
Percentage of Renter-Occupied Units in Mississippi is 30.8%.
What is the Percentage of Renter-Occupied Units in the United States?
Percentage of Renter-Occupied Units in the United States is 35.2%.