Zip Codes with the Highest Percentage of Population Employed in Agriculture, Fishing & Hunting in Tupelo, MS
RELATED REPORTS & OPTIONS
Agriculture, Fishing & Hunting
Tupelo
Compare Zip Codes
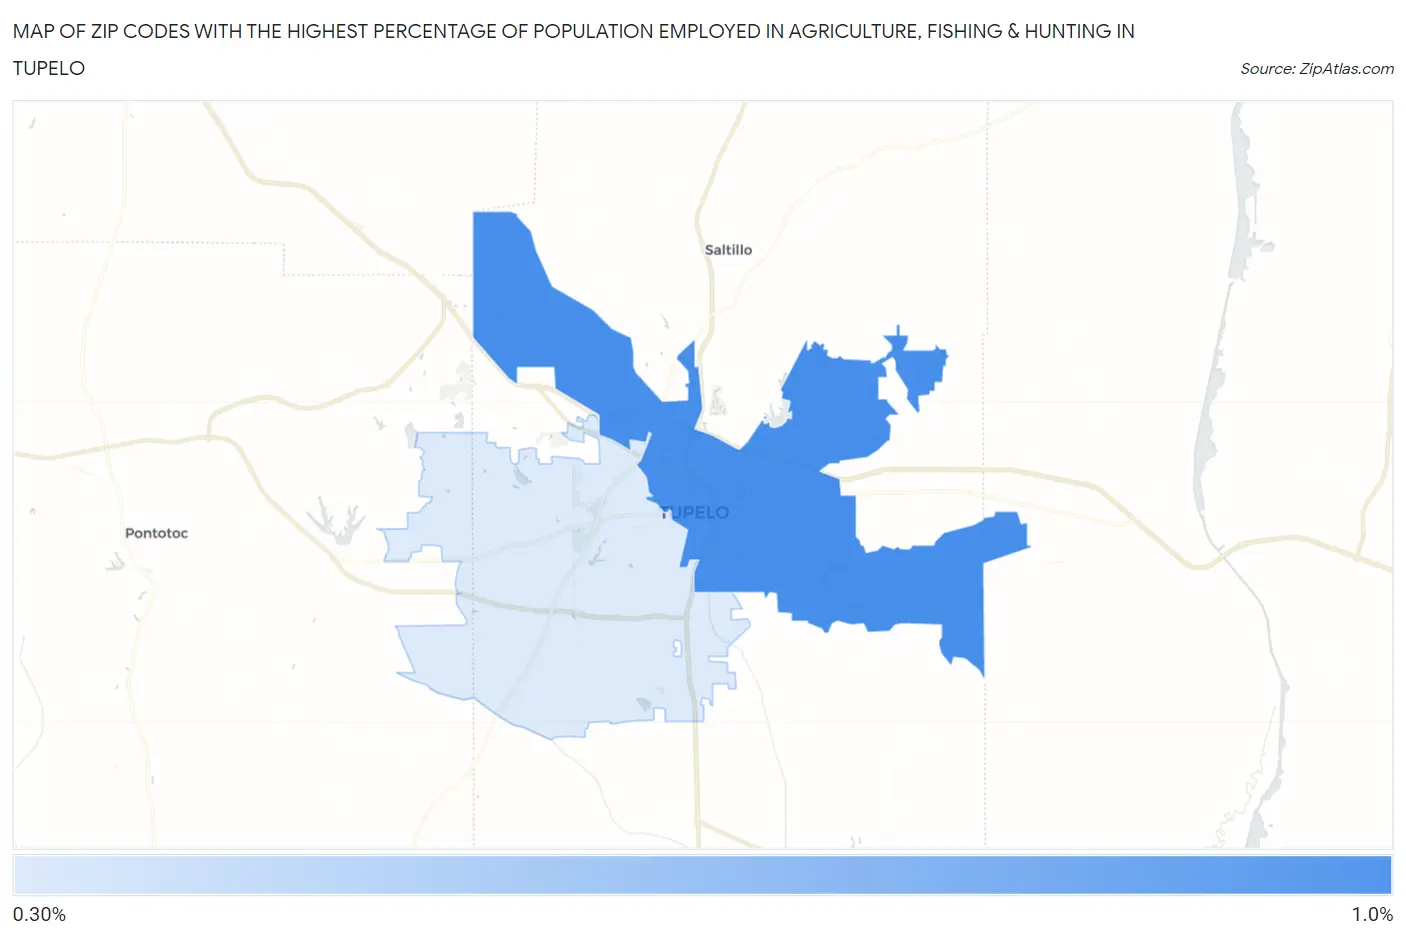
Map of Zip Codes with the Highest Percentage of Population Employed in Agriculture, Fishing & Hunting in Tupelo
0.30%
0.85%
Zip Codes with the Highest Percentage of Population Employed in Agriculture, Fishing & Hunting in Tupelo, MS
| Zip Code | % Employed | vs State | vs National | |
| 1. | 38804 | 0.85% | 1.6%(-0.698)#225 | 1.2%(-0.347)#16,967 |
| 2. | 38801 | 0.30% | 1.6%(-1.25)#274 | 1.2%(-0.897)#21,140 |
1
Common Questions
What are the Top Zip Codes with the Highest Percentage of Population Employed in Agriculture, Fishing & Hunting in Tupelo, MS?
Top Zip Codes with the Highest Percentage of Population Employed in Agriculture, Fishing & Hunting in Tupelo, MS are:
What zip code has the Highest Percentage of Population Employed in Agriculture, Fishing & Hunting in Tupelo, MS?
38804 has the Highest Percentage of Population Employed in Agriculture, Fishing & Hunting in Tupelo, MS with 0.85%.
What is the Percentage of Population Employed in Agriculture, Fishing & Hunting in Tupelo, MS?
Percentage of Population Employed in Agriculture, Fishing & Hunting in Tupelo is 0.60%.
What is the Percentage of Population Employed in Agriculture, Fishing & Hunting in Mississippi?
Percentage of Population Employed in Agriculture, Fishing & Hunting in Mississippi is 1.6%.
What is the Percentage of Population Employed in Agriculture, Fishing & Hunting in the United States?
Percentage of Population Employed in Agriculture, Fishing & Hunting in the United States is 1.2%.