Zip Codes with the Highest Percentage of Population Employed in Farming, Fishing & Forestry in Laurel, MS
RELATED REPORTS & OPTIONS
Select to Compare
Select to Compare
Compare Zip Codes
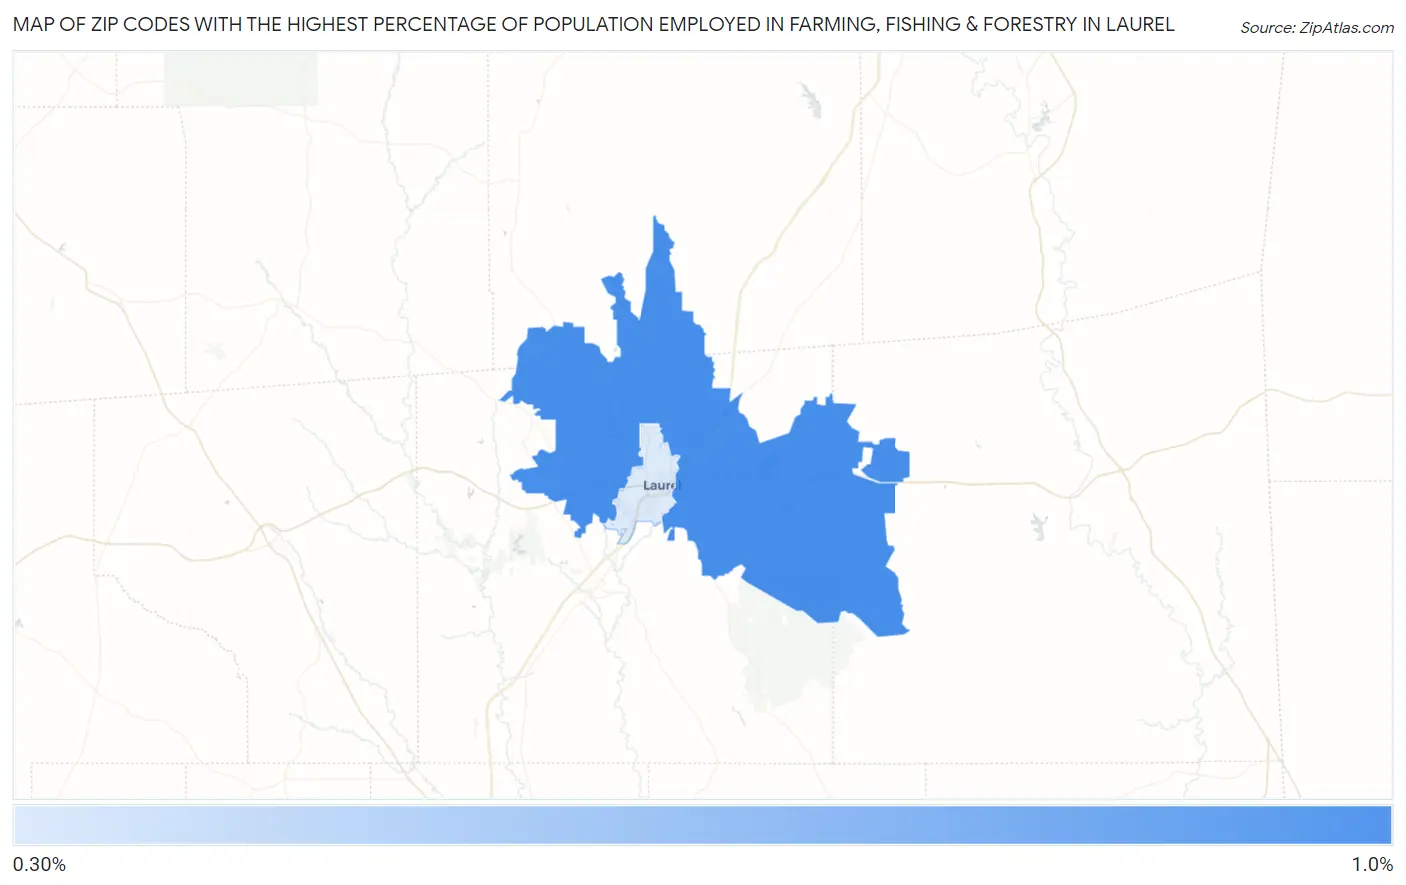
Map of Zip Codes with the Highest Percentage of Population Employed in Farming, Fishing & Forestry in Laurel
0.0%
1.5%
Zip Codes with the Highest Percentage of Population Employed in Farming, Fishing & Forestry in Laurel, MS
| Zip Code | % Employed | vs State | vs National | |
| 1. | 39443 | 1.1% | 0.63%(+0.482)#111 | 0.61%(+0.506)#9,275 |
1
Common Questions
What are the Top Zip Codes with the Highest Percentage of Population Employed in Farming, Fishing & Forestry in Laurel, MS?
Top Zip Codes with the Highest Percentage of Population Employed in Farming, Fishing & Forestry in Laurel, MS are:
What zip code has the Highest Percentage of Population Employed in Farming, Fishing & Forestry in Laurel, MS?
39443 has the Highest Percentage of Population Employed in Farming, Fishing & Forestry in Laurel, MS with 1.1%.
What is the Percentage of Population Employed in Farming, Fishing & Forestry in Mississippi?
Percentage of Population Employed in Farming, Fishing & Forestry in Mississippi is 0.63%.
What is the Percentage of Population Employed in Farming, Fishing & Forestry in the United States?
Percentage of Population Employed in Farming, Fishing & Forestry in the United States is 0.61%.