Venezuelan vs Immigrants from Ukraine In Labor Force | Age 25-29
COMPARE
Venezuelan
Immigrants from Ukraine
In Labor Force | Age 25-29
In Labor Force | Age 25-29 Comparison
Venezuelans
Immigrants from Ukraine
84.4%
IN LABOR FORCE | AGE 25-29
15.1/ 100
METRIC RATING
204th/ 347
METRIC RANK
84.5%
IN LABOR FORCE | AGE 25-29
33.7/ 100
METRIC RATING
188th/ 347
METRIC RANK
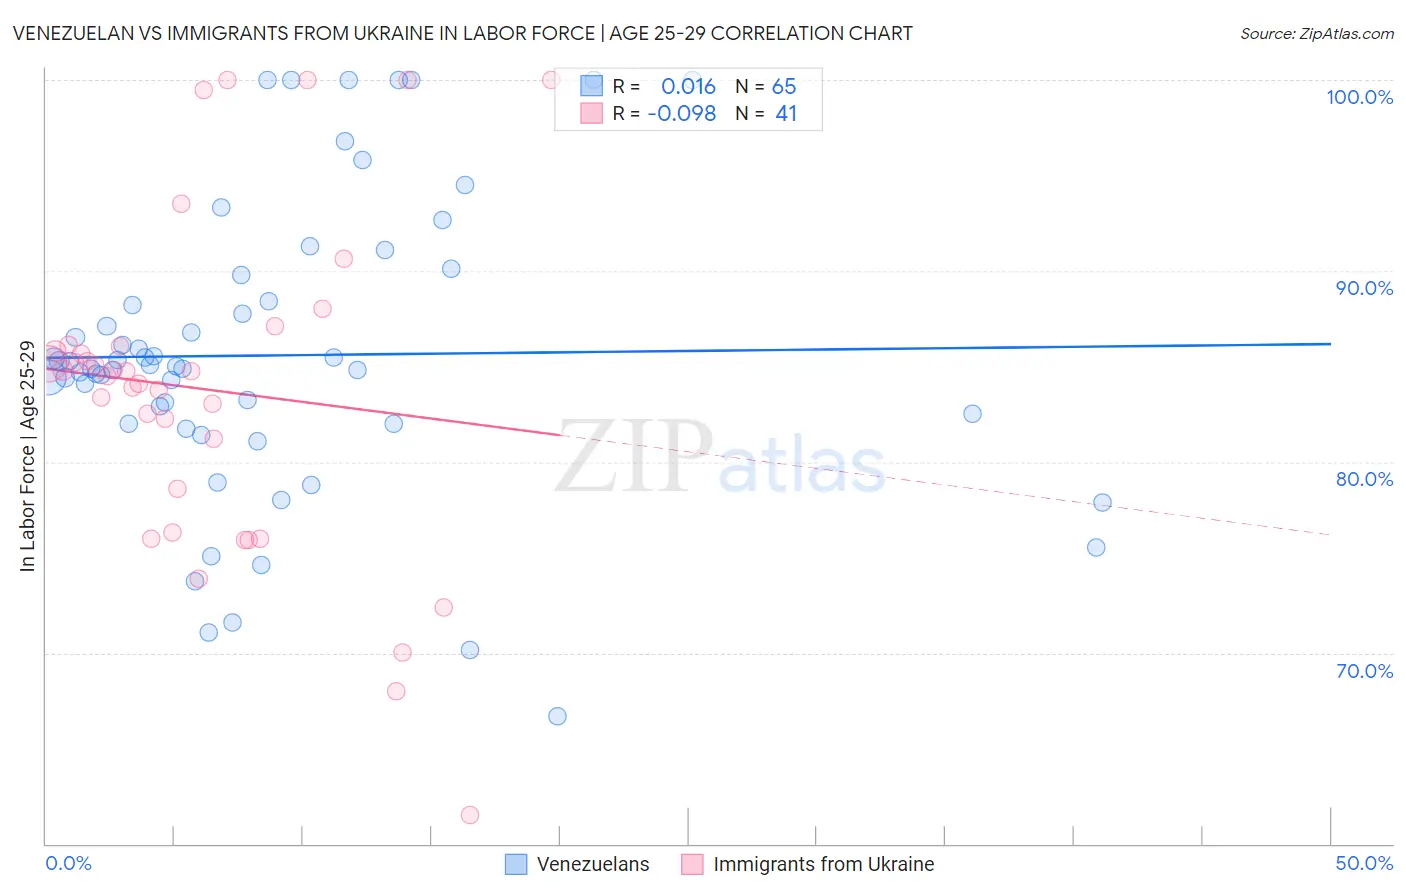
Venezuelan vs Immigrants from Ukraine In Labor Force | Age 25-29 Correlation Chart
The statistical analysis conducted on geographies consisting of 306,279,801 people shows no correlation between the proportion of Venezuelans and labor force participation rate among population between the ages 25 and 29 in the United States with a correlation coefficient (R) of 0.016 and weighted average of 84.4%. Similarly, the statistical analysis conducted on geographies consisting of 289,661,543 people shows a slight negative correlation between the proportion of Immigrants from Ukraine and labor force participation rate among population between the ages 25 and 29 in the United States with a correlation coefficient (R) of -0.098 and weighted average of 84.5%, a difference of 0.19%.
In Labor Force | Age 25-29 Correlation Summary
| Measurement | Venezuelan | Immigrants from Ukraine |
| Minimum | 66.7% | 61.5% |
| Maximum | 100.0% | 100.0% |
| Range | 33.3% | 38.5% |
| Mean | 85.6% | 83.8% |
| Median | 85.0% | 84.7% |
| Interquartile 25% (IQ1) | 82.0% | 77.5% |
| Interquartile 75% (IQ3) | 89.1% | 86.1% |
| Interquartile Range (IQR) | 7.1% | 8.6% |
| Standard Deviation (Sample) | 7.7% | 8.7% |
| Standard Deviation (Population) | 7.6% | 8.6% |
Demographics Similar to Venezuelans and Immigrants from Ukraine by In Labor Force | Age 25-29
In terms of in labor force | age 25-29, the demographic groups most similar to Venezuelans are Ecuadorian (84.4%, a difference of 0.0%), Afghan (84.4%, a difference of 0.010%), Immigrants from Afghanistan (84.4%, a difference of 0.010%), Immigrants from Cambodia (84.4%, a difference of 0.010%), and Laotian (84.4%, a difference of 0.020%). Similarly, the demographic groups most similar to Immigrants from Ukraine are Immigrants from Belgium (84.6%, a difference of 0.010%), Immigrants from Portugal (84.6%, a difference of 0.010%), Moroccan (84.5%, a difference of 0.010%), Welsh (84.5%, a difference of 0.020%), and Zimbabwean (84.5%, a difference of 0.040%).
| Demographics | Rating | Rank | In Labor Force | Age 25-29 |
| Immigrants | Belgium | 35.0 /100 | #186 | Fair 84.6% |
| Immigrants | Portugal | 34.7 /100 | #187 | Fair 84.6% |
| Immigrants | Ukraine | 33.7 /100 | #188 | Fair 84.5% |
| Moroccans | 32.6 /100 | #189 | Fair 84.5% |
| Welsh | 31.1 /100 | #190 | Fair 84.5% |
| Zimbabweans | 28.7 /100 | #191 | Fair 84.5% |
| English | 25.8 /100 | #192 | Fair 84.5% |
| South American Indians | 25.0 /100 | #193 | Fair 84.5% |
| Portuguese | 21.2 /100 | #194 | Fair 84.4% |
| Immigrants | Israel | 20.8 /100 | #195 | Fair 84.4% |
| Immigrants | South Eastern Asia | 19.5 /100 | #196 | Poor 84.4% |
| Tlingit-Haida | 19.3 /100 | #197 | Poor 84.4% |
| Immigrants | Iraq | 19.0 /100 | #198 | Poor 84.4% |
| Immigrants | Germany | 18.3 /100 | #199 | Poor 84.4% |
| Immigrants | Kazakhstan | 17.5 /100 | #200 | Poor 84.4% |
| Laotians | 16.6 /100 | #201 | Poor 84.4% |
| Afghans | 15.9 /100 | #202 | Poor 84.4% |
| Immigrants | Afghanistan | 15.6 /100 | #203 | Poor 84.4% |
| Venezuelans | 15.1 /100 | #204 | Poor 84.4% |
| Ecuadorians | 14.8 /100 | #205 | Poor 84.4% |
| Immigrants | Cambodia | 14.3 /100 | #206 | Poor 84.4% |