Yuman vs Immigrants from Ukraine In Labor Force | Age 25-29
COMPARE
Yuman
Immigrants from Ukraine
In Labor Force | Age 25-29
In Labor Force | Age 25-29 Comparison
Yuman
Immigrants from Ukraine
79.3%
IN LABOR FORCE | AGE 25-29
0.0/ 100
METRIC RATING
334th/ 347
METRIC RANK
84.5%
IN LABOR FORCE | AGE 25-29
33.7/ 100
METRIC RATING
188th/ 347
METRIC RANK
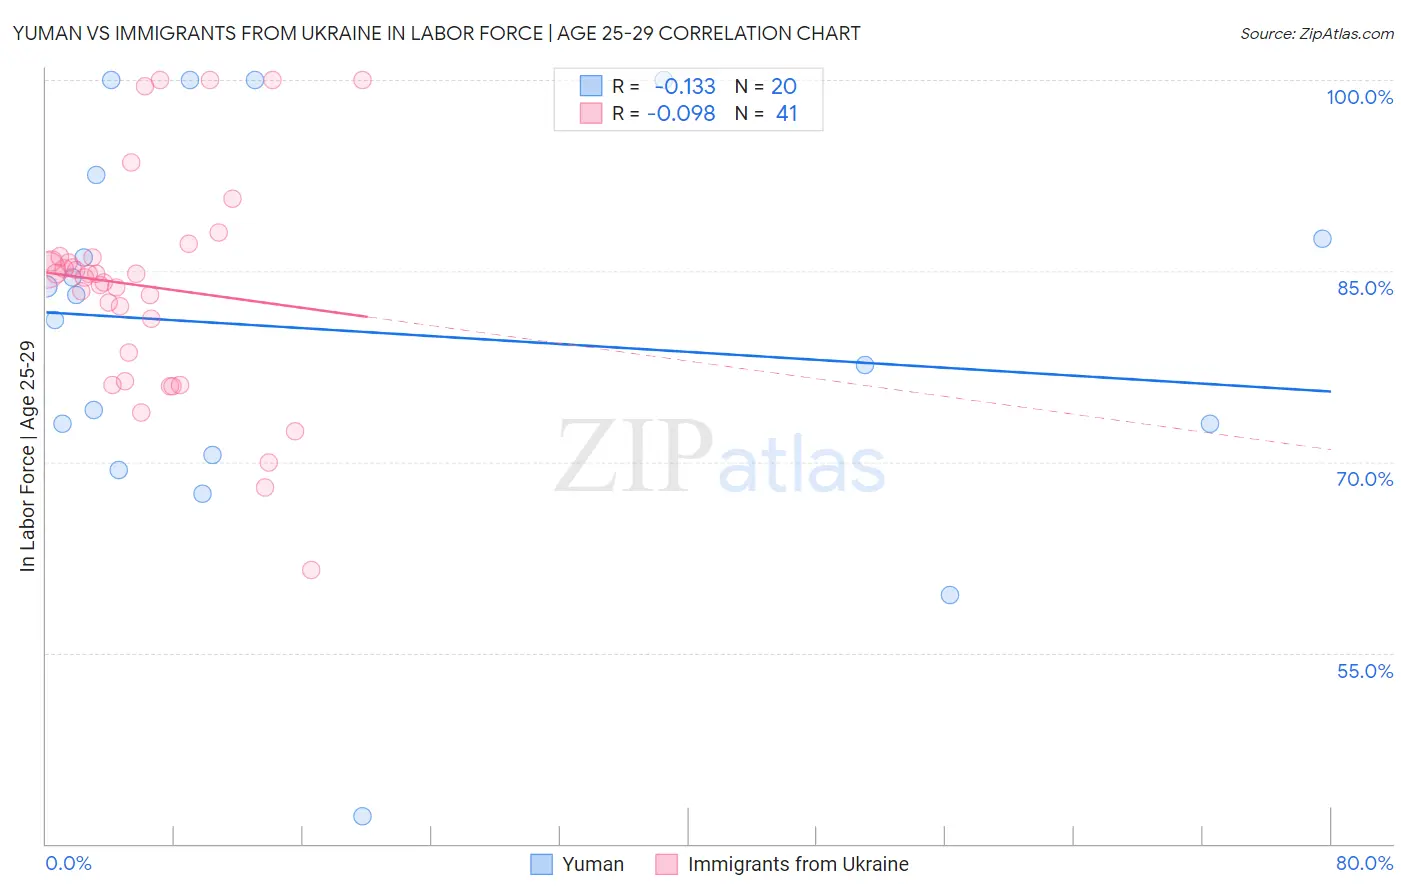
Yuman vs Immigrants from Ukraine In Labor Force | Age 25-29 Correlation Chart
The statistical analysis conducted on geographies consisting of 40,683,132 people shows a poor negative correlation between the proportion of Yuman and labor force participation rate among population between the ages 25 and 29 in the United States with a correlation coefficient (R) of -0.133 and weighted average of 79.3%. Similarly, the statistical analysis conducted on geographies consisting of 289,661,543 people shows a slight negative correlation between the proportion of Immigrants from Ukraine and labor force participation rate among population between the ages 25 and 29 in the United States with a correlation coefficient (R) of -0.098 and weighted average of 84.5%, a difference of 6.6%.
In Labor Force | Age 25-29 Correlation Summary
| Measurement | Yuman | Immigrants from Ukraine |
| Minimum | 42.2% | 61.5% |
| Maximum | 100.0% | 100.0% |
| Range | 57.8% | 38.5% |
| Mean | 80.3% | 83.8% |
| Median | 82.1% | 84.7% |
| Interquartile 25% (IQ1) | 71.7% | 77.5% |
| Interquartile 75% (IQ3) | 90.0% | 86.1% |
| Interquartile Range (IQR) | 18.3% | 8.6% |
| Standard Deviation (Sample) | 14.9% | 8.7% |
| Standard Deviation (Population) | 14.6% | 8.6% |
Similar Demographics by In Labor Force | Age 25-29
Demographics Similar to Yuman by In Labor Force | Age 25-29
In terms of in labor force | age 25-29, the demographic groups most similar to Yuman are Native/Alaskan (79.3%, a difference of 0.080%), Apache (79.2%, a difference of 0.16%), Sioux (79.7%, a difference of 0.42%), Inupiat (79.8%, a difference of 0.53%), and Crow (78.6%, a difference of 0.91%).
| Demographics | Rating | Rank | In Labor Force | Age 25-29 |
| Ute | 0.0 /100 | #327 | Tragic 80.8% |
| Creek | 0.0 /100 | #328 | Tragic 80.7% |
| Yakama | 0.0 /100 | #329 | Tragic 80.6% |
| Puerto Ricans | 0.0 /100 | #330 | Tragic 80.4% |
| Cheyenne | 0.0 /100 | #331 | Tragic 80.3% |
| Inupiat | 0.0 /100 | #332 | Tragic 79.8% |
| Sioux | 0.0 /100 | #333 | Tragic 79.7% |
| Yuman | 0.0 /100 | #334 | Tragic 79.3% |
| Natives/Alaskans | 0.0 /100 | #335 | Tragic 79.3% |
| Apache | 0.0 /100 | #336 | Tragic 79.2% |
| Crow | 0.0 /100 | #337 | Tragic 78.6% |
| Lumbee | 0.0 /100 | #338 | Tragic 78.3% |
| Immigrants | Yemen | 0.0 /100 | #339 | Tragic 78.2% |
| Paiute | 0.0 /100 | #340 | Tragic 78.1% |
| Tohono O'odham | 0.0 /100 | #341 | Tragic 77.5% |
Demographics Similar to Immigrants from Ukraine by In Labor Force | Age 25-29
In terms of in labor force | age 25-29, the demographic groups most similar to Immigrants from Ukraine are Immigrants from Belgium (84.6%, a difference of 0.010%), Immigrants from Portugal (84.6%, a difference of 0.010%), Moroccan (84.5%, a difference of 0.010%), Welsh (84.5%, a difference of 0.020%), and Immigrants from Denmark (84.6%, a difference of 0.030%).
| Demographics | Rating | Rank | In Labor Force | Age 25-29 |
| Immigrants | Norway | 41.9 /100 | #181 | Average 84.6% |
| Europeans | 40.3 /100 | #182 | Average 84.6% |
| Scottish | 40.1 /100 | #183 | Average 84.6% |
| Immigrants | Kuwait | 38.2 /100 | #184 | Fair 84.6% |
| Immigrants | Denmark | 37.0 /100 | #185 | Fair 84.6% |
| Immigrants | Belgium | 35.0 /100 | #186 | Fair 84.6% |
| Immigrants | Portugal | 34.7 /100 | #187 | Fair 84.6% |
| Immigrants | Ukraine | 33.7 /100 | #188 | Fair 84.5% |
| Moroccans | 32.6 /100 | #189 | Fair 84.5% |
| Welsh | 31.1 /100 | #190 | Fair 84.5% |
| Zimbabweans | 28.7 /100 | #191 | Fair 84.5% |
| English | 25.8 /100 | #192 | Fair 84.5% |
| South American Indians | 25.0 /100 | #193 | Fair 84.5% |
| Portuguese | 21.2 /100 | #194 | Fair 84.4% |
| Immigrants | Israel | 20.8 /100 | #195 | Fair 84.4% |