Venezuelan vs Immigrants from Sri Lanka In Labor Force | Age 25-29
COMPARE
Venezuelan
Immigrants from Sri Lanka
In Labor Force | Age 25-29
In Labor Force | Age 25-29 Comparison
Venezuelans
Immigrants from Sri Lanka
84.4%
IN LABOR FORCE | AGE 25-29
15.1/ 100
METRIC RATING
204th/ 347
METRIC RANK
84.7%
IN LABOR FORCE | AGE 25-29
61.7/ 100
METRIC RATING
154th/ 347
METRIC RANK
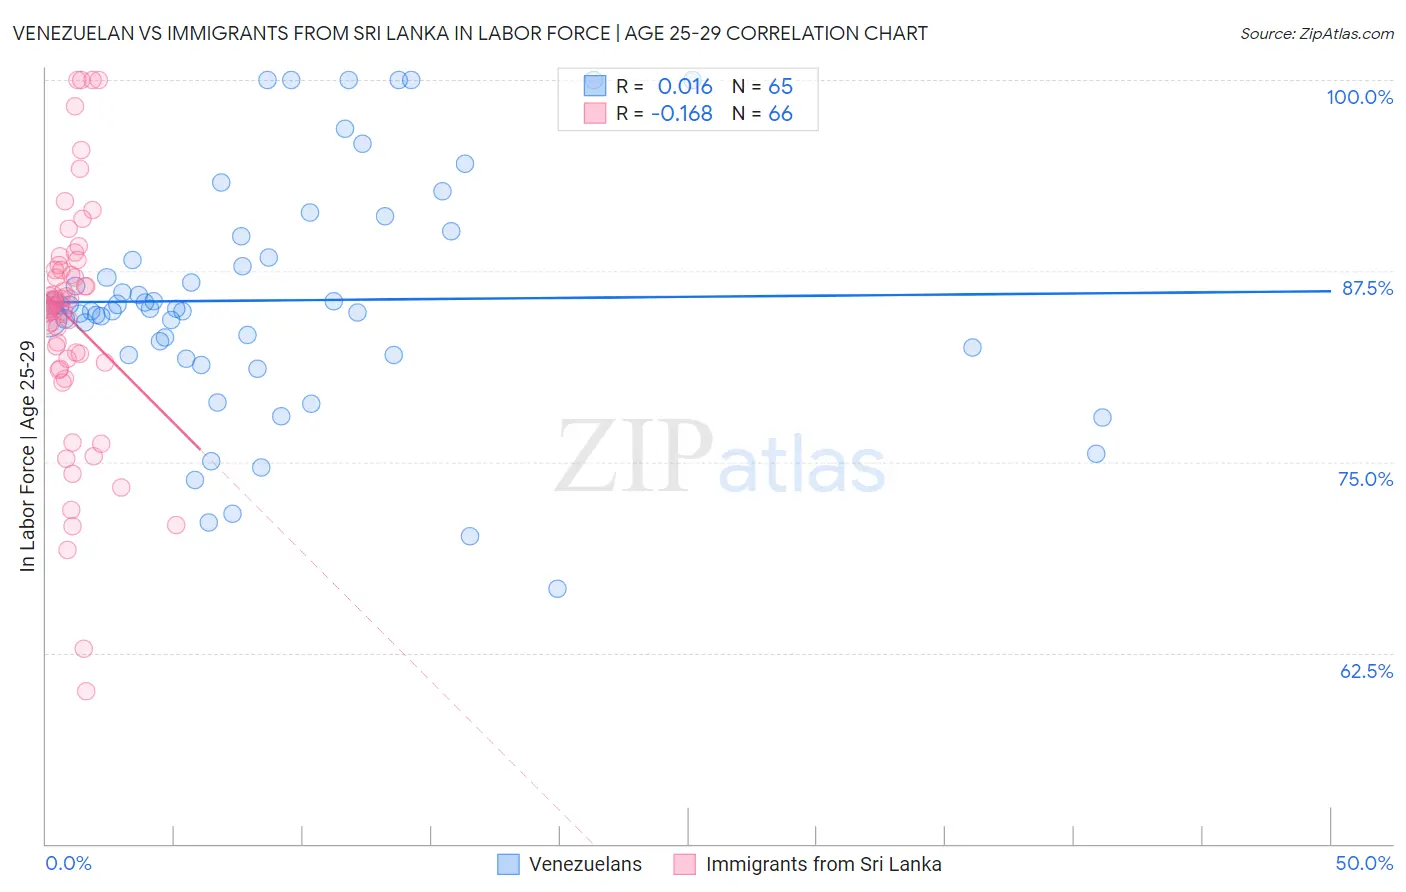
Venezuelan vs Immigrants from Sri Lanka In Labor Force | Age 25-29 Correlation Chart
The statistical analysis conducted on geographies consisting of 306,279,801 people shows no correlation between the proportion of Venezuelans and labor force participation rate among population between the ages 25 and 29 in the United States with a correlation coefficient (R) of 0.016 and weighted average of 84.4%. Similarly, the statistical analysis conducted on geographies consisting of 149,692,146 people shows a poor negative correlation between the proportion of Immigrants from Sri Lanka and labor force participation rate among population between the ages 25 and 29 in the United States with a correlation coefficient (R) of -0.168 and weighted average of 84.7%, a difference of 0.41%.
In Labor Force | Age 25-29 Correlation Summary
| Measurement | Venezuelan | Immigrants from Sri Lanka |
| Minimum | 66.7% | 60.0% |
| Maximum | 100.0% | 100.0% |
| Range | 33.3% | 40.0% |
| Mean | 85.6% | 84.3% |
| Median | 85.0% | 85.2% |
| Interquartile 25% (IQ1) | 82.0% | 81.5% |
| Interquartile 75% (IQ3) | 89.1% | 87.6% |
| Interquartile Range (IQR) | 7.1% | 6.1% |
| Standard Deviation (Sample) | 7.7% | 8.0% |
| Standard Deviation (Population) | 7.6% | 7.9% |
Similar Demographics by In Labor Force | Age 25-29
Demographics Similar to Venezuelans by In Labor Force | Age 25-29
In terms of in labor force | age 25-29, the demographic groups most similar to Venezuelans are Ecuadorian (84.4%, a difference of 0.0%), Afghan (84.4%, a difference of 0.010%), Immigrants from Afghanistan (84.4%, a difference of 0.010%), Immigrants from Cambodia (84.4%, a difference of 0.010%), and Laotian (84.4%, a difference of 0.020%).
| Demographics | Rating | Rank | In Labor Force | Age 25-29 |
| Tlingit-Haida | 19.3 /100 | #197 | Poor 84.4% |
| Immigrants | Iraq | 19.0 /100 | #198 | Poor 84.4% |
| Immigrants | Germany | 18.3 /100 | #199 | Poor 84.4% |
| Immigrants | Kazakhstan | 17.5 /100 | #200 | Poor 84.4% |
| Laotians | 16.6 /100 | #201 | Poor 84.4% |
| Afghans | 15.9 /100 | #202 | Poor 84.4% |
| Immigrants | Afghanistan | 15.6 /100 | #203 | Poor 84.4% |
| Venezuelans | 15.1 /100 | #204 | Poor 84.4% |
| Ecuadorians | 14.8 /100 | #205 | Poor 84.4% |
| Immigrants | Cambodia | 14.3 /100 | #206 | Poor 84.4% |
| Immigrants | Armenia | 13.3 /100 | #207 | Poor 84.4% |
| Immigrants | Indonesia | 13.2 /100 | #208 | Poor 84.4% |
| Immigrants | Jordan | 12.8 /100 | #209 | Poor 84.4% |
| Chinese | 12.7 /100 | #210 | Poor 84.3% |
| Immigrants | Venezuela | 12.6 /100 | #211 | Poor 84.3% |
Demographics Similar to Immigrants from Sri Lanka by In Labor Force | Age 25-29
In terms of in labor force | age 25-29, the demographic groups most similar to Immigrants from Sri Lanka are Immigrants from Taiwan (84.7%, a difference of 0.0%), Indian (Asian) (84.7%, a difference of 0.0%), French (84.7%, a difference of 0.0%), Colombian (84.7%, a difference of 0.010%), and Immigrants from Pakistan (84.7%, a difference of 0.010%).
| Demographics | Rating | Rank | In Labor Force | Age 25-29 |
| Immigrants | Asia | 68.2 /100 | #147 | Good 84.8% |
| Immigrants | England | 65.2 /100 | #148 | Good 84.7% |
| Peruvians | 64.7 /100 | #149 | Good 84.7% |
| Swiss | 64.7 /100 | #150 | Good 84.7% |
| Colombians | 62.8 /100 | #151 | Good 84.7% |
| Immigrants | Pakistan | 62.7 /100 | #152 | Good 84.7% |
| Immigrants | Taiwan | 62.2 /100 | #153 | Good 84.7% |
| Immigrants | Sri Lanka | 61.7 /100 | #154 | Good 84.7% |
| Indians (Asian) | 61.6 /100 | #155 | Good 84.7% |
| French | 61.0 /100 | #156 | Good 84.7% |
| British | 60.4 /100 | #157 | Good 84.7% |
| Immigrants | Ghana | 60.2 /100 | #158 | Good 84.7% |
| Immigrants | Western Africa | 60.1 /100 | #159 | Good 84.7% |
| Immigrants | Peru | 58.6 /100 | #160 | Average 84.7% |
| Canadians | 58.5 /100 | #161 | Average 84.7% |