Turkish vs Immigrants from Pakistan In Labor Force | Age > 16
COMPARE
Turkish
Immigrants from Pakistan
In Labor Force | Age > 16
In Labor Force | Age > 16 Comparison
Turks
Immigrants from Pakistan
66.1%
IN LABOR FORCE | AGE > 16
99.6/ 100
METRIC RATING
79th/ 347
METRIC RANK
66.7%
IN LABOR FORCE | AGE > 16
100.0/ 100
METRIC RATING
44th/ 347
METRIC RANK
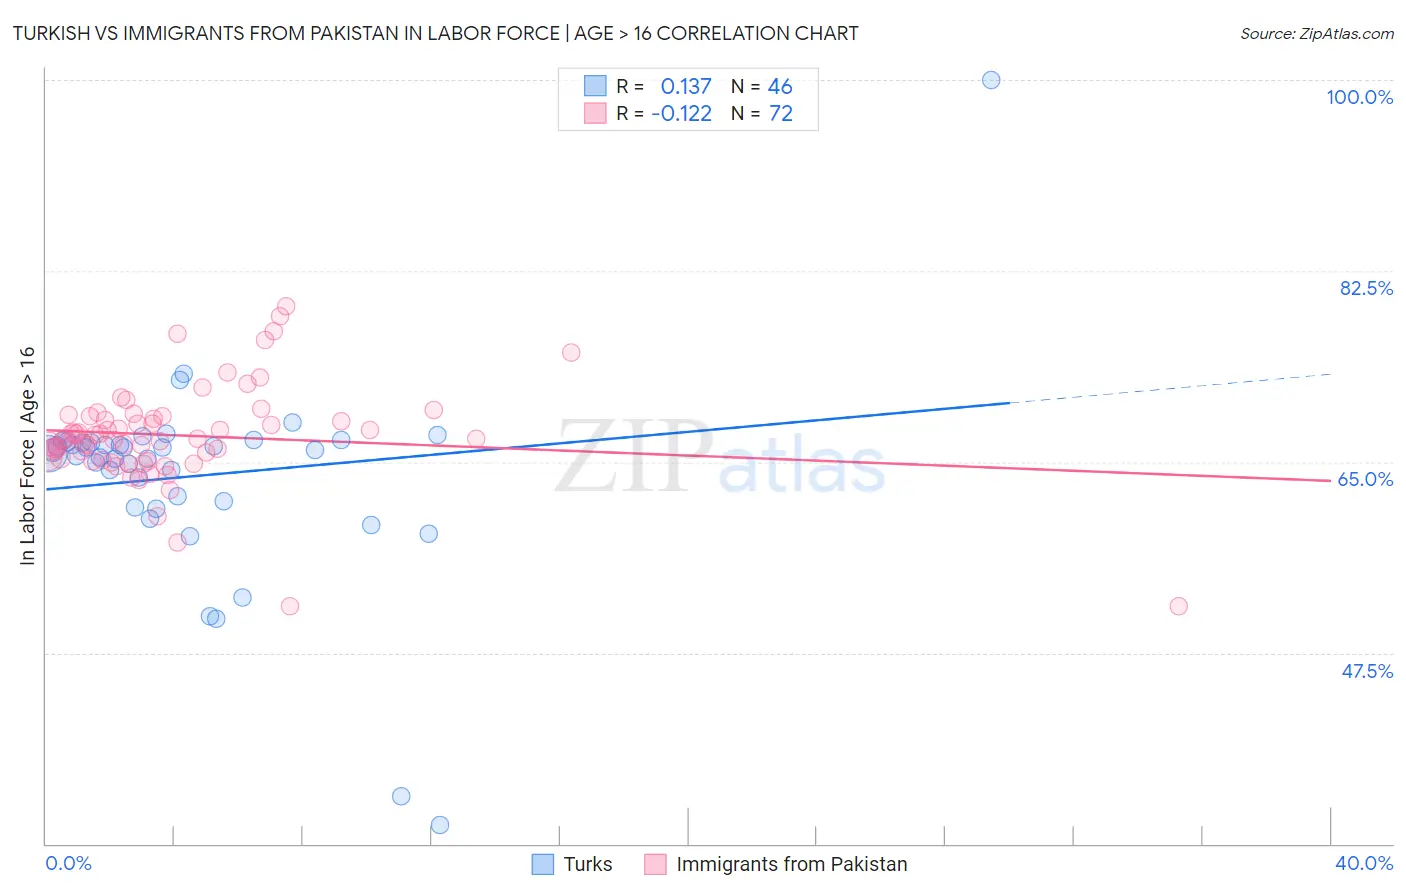
Turkish vs Immigrants from Pakistan In Labor Force | Age > 16 Correlation Chart
The statistical analysis conducted on geographies consisting of 271,859,072 people shows a poor positive correlation between the proportion of Turks and labor force participation rate among population ages 16 and over in the United States with a correlation coefficient (R) of 0.137 and weighted average of 66.1%. Similarly, the statistical analysis conducted on geographies consisting of 283,909,562 people shows a poor negative correlation between the proportion of Immigrants from Pakistan and labor force participation rate among population ages 16 and over in the United States with a correlation coefficient (R) of -0.122 and weighted average of 66.7%, a difference of 0.88%.
In Labor Force | Age > 16 Correlation Summary
| Measurement | Turkish | Immigrants from Pakistan |
| Minimum | 31.7% | 51.8% |
| Maximum | 100.0% | 79.3% |
| Range | 68.3% | 27.5% |
| Mean | 63.7% | 67.4% |
| Median | 65.9% | 67.1% |
| Interquartile 25% (IQ1) | 61.4% | 65.3% |
| Interquartile 75% (IQ3) | 66.8% | 69.2% |
| Interquartile Range (IQR) | 5.4% | 3.9% |
| Standard Deviation (Sample) | 9.6% | 4.7% |
| Standard Deviation (Population) | 9.5% | 4.6% |
Similar Demographics by In Labor Force | Age > 16
Demographics Similar to Turks by In Labor Force | Age > 16
In terms of in labor force | age > 16, the demographic groups most similar to Turks are Malaysian (66.1%, a difference of 0.010%), Immigrants from Moldova (66.1%, a difference of 0.030%), Immigrants from Asia (66.1%, a difference of 0.030%), Immigrants from Malaysia (66.1%, a difference of 0.040%), and Moroccan (66.1%, a difference of 0.060%).
| Demographics | Rating | Rank | In Labor Force | Age > 16 |
| Taiwanese | 99.7 /100 | #72 | Exceptional 66.2% |
| Immigrants | Vietnam | 99.7 /100 | #73 | Exceptional 66.2% |
| Immigrants | Korea | 99.7 /100 | #74 | Exceptional 66.2% |
| Immigrants | Singapore | 99.7 /100 | #75 | Exceptional 66.2% |
| Immigrants | Malaysia | 99.6 /100 | #76 | Exceptional 66.1% |
| Immigrants | Moldova | 99.6 /100 | #77 | Exceptional 66.1% |
| Immigrants | Asia | 99.6 /100 | #78 | Exceptional 66.1% |
| Turks | 99.6 /100 | #79 | Exceptional 66.1% |
| Malaysians | 99.6 /100 | #80 | Exceptional 66.1% |
| Moroccans | 99.5 /100 | #81 | Exceptional 66.1% |
| German Russians | 99.4 /100 | #82 | Exceptional 66.1% |
| Immigrants | Jordan | 99.4 /100 | #83 | Exceptional 66.1% |
| Central Americans | 99.4 /100 | #84 | Exceptional 66.1% |
| Mongolians | 99.4 /100 | #85 | Exceptional 66.1% |
| South Americans | 99.4 /100 | #86 | Exceptional 66.0% |
Demographics Similar to Immigrants from Pakistan by In Labor Force | Age > 16
In terms of in labor force | age > 16, the demographic groups most similar to Immigrants from Pakistan are Luxembourger (66.7%, a difference of 0.050%), Immigrants from Brazil (66.7%, a difference of 0.050%), Senegalese (66.7%, a difference of 0.070%), Brazilian (66.6%, a difference of 0.12%), and Immigrants from Bulgaria (66.6%, a difference of 0.12%).
| Demographics | Rating | Rank | In Labor Force | Age > 16 |
| Immigrants | Afghanistan | 100.0 /100 | #37 | Exceptional 67.0% |
| Immigrants | Nigeria | 100.0 /100 | #38 | Exceptional 66.9% |
| Salvadorans | 100.0 /100 | #39 | Exceptional 66.8% |
| Immigrants | El Salvador | 100.0 /100 | #40 | Exceptional 66.8% |
| Immigrants | Zimbabwe | 100.0 /100 | #41 | Exceptional 66.8% |
| Senegalese | 100.0 /100 | #42 | Exceptional 66.7% |
| Luxembourgers | 100.0 /100 | #43 | Exceptional 66.7% |
| Immigrants | Pakistan | 100.0 /100 | #44 | Exceptional 66.7% |
| Immigrants | Brazil | 100.0 /100 | #45 | Exceptional 66.7% |
| Brazilians | 100.0 /100 | #46 | Exceptional 66.6% |
| Immigrants | Bulgaria | 100.0 /100 | #47 | Exceptional 66.6% |
| Nigerians | 100.0 /100 | #48 | Exceptional 66.6% |
| Immigrants | Northern Africa | 100.0 /100 | #49 | Exceptional 66.6% |
| Cape Verdeans | 100.0 /100 | #50 | Exceptional 66.6% |
| Immigrants | Kuwait | 100.0 /100 | #51 | Exceptional 66.5% |