Trinidadian and Tobagonian vs Pennsylvania German In Labor Force | Age 25-29
COMPARE
Trinidadian and Tobagonian
Pennsylvania German
In Labor Force | Age 25-29
In Labor Force | Age 25-29 Comparison
Trinidadians and Tobagonians
Pennsylvania Germans
83.9%
IN LABOR FORCE | AGE 25-29
0.7/ 100
METRIC RATING
240th/ 347
METRIC RANK
83.6%
IN LABOR FORCE | AGE 25-29
0.1/ 100
METRIC RATING
261st/ 347
METRIC RANK
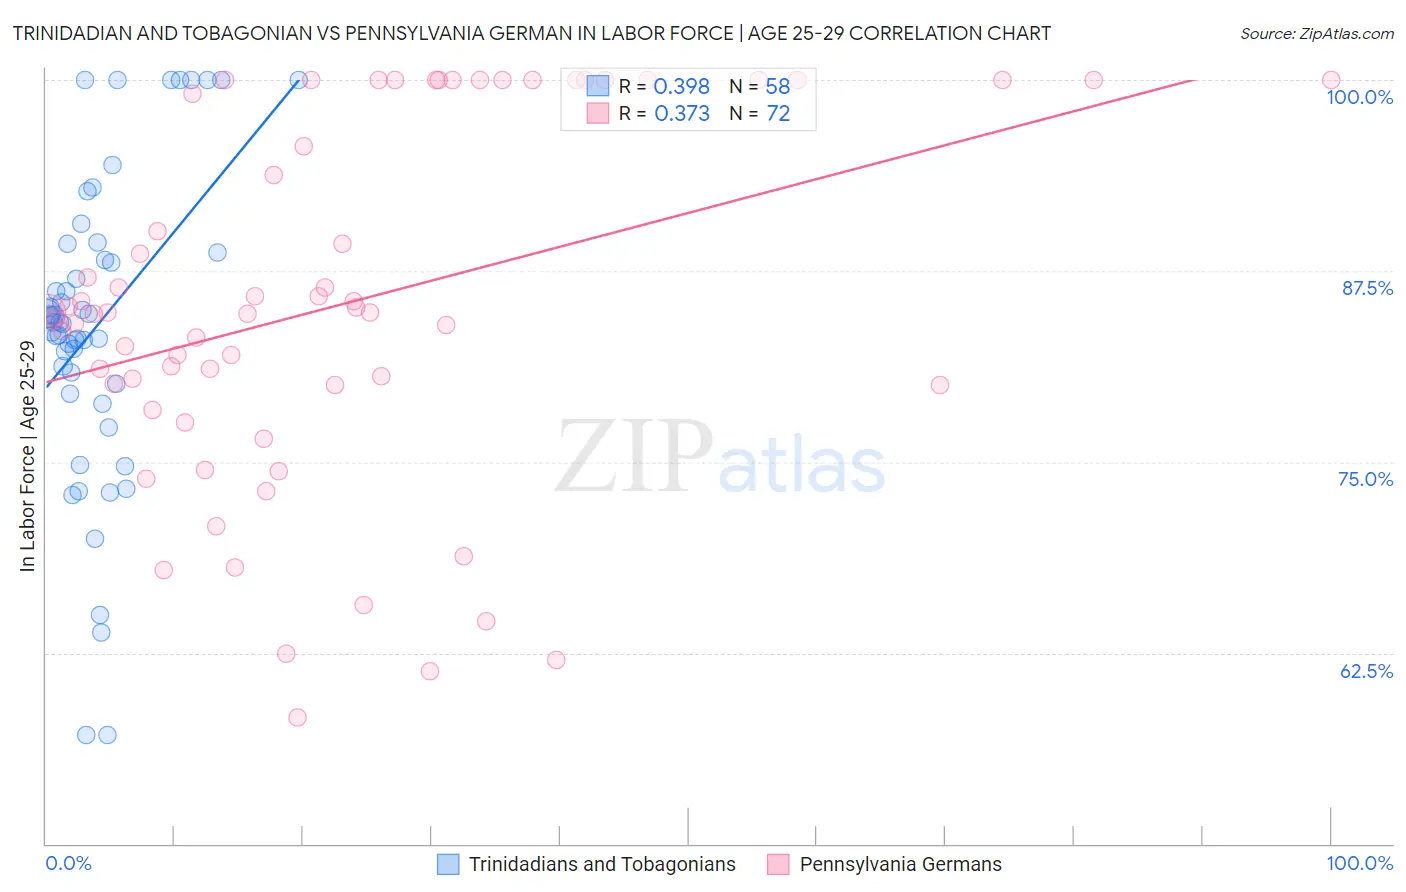
Trinidadian and Tobagonian vs Pennsylvania German In Labor Force | Age 25-29 Correlation Chart
The statistical analysis conducted on geographies consisting of 219,834,546 people shows a mild positive correlation between the proportion of Trinidadians and Tobagonians and labor force participation rate among population between the ages 25 and 29 in the United States with a correlation coefficient (R) of 0.398 and weighted average of 83.9%. Similarly, the statistical analysis conducted on geographies consisting of 234,004,044 people shows a mild positive correlation between the proportion of Pennsylvania Germans and labor force participation rate among population between the ages 25 and 29 in the United States with a correlation coefficient (R) of 0.373 and weighted average of 83.6%, a difference of 0.33%.
In Labor Force | Age 25-29 Correlation Summary
| Measurement | Trinidadian and Tobagonian | Pennsylvania German |
| Minimum | 57.1% | 58.3% |
| Maximum | 100.0% | 100.0% |
| Range | 42.9% | 41.7% |
| Mean | 83.9% | 85.3% |
| Median | 84.2% | 84.8% |
| Interquartile 25% (IQ1) | 80.1% | 80.0% |
| Interquartile 75% (IQ3) | 88.7% | 100.0% |
| Interquartile Range (IQR) | 8.6% | 20.0% |
| Standard Deviation (Sample) | 10.0% | 11.7% |
| Standard Deviation (Population) | 9.9% | 11.6% |
Similar Demographics by In Labor Force | Age 25-29
Demographics Similar to Trinidadians and Tobagonians by In Labor Force | Age 25-29
In terms of in labor force | age 25-29, the demographic groups most similar to Trinidadians and Tobagonians are Jamaican (83.9%, a difference of 0.0%), Immigrants from Uzbekistan (83.9%, a difference of 0.010%), Alsatian (83.9%, a difference of 0.020%), Iraqi (83.9%, a difference of 0.040%), and Guamanian/Chamorro (83.9%, a difference of 0.040%).
| Demographics | Rating | Rank | In Labor Force | Age 25-29 |
| Immigrants | Western Asia | 2.7 /100 | #233 | Tragic 84.1% |
| Barbadians | 1.0 /100 | #234 | Tragic 83.9% |
| Iraqis | 0.9 /100 | #235 | Tragic 83.9% |
| Guamanians/Chamorros | 0.9 /100 | #236 | Tragic 83.9% |
| Immigrants | Immigrants | 0.9 /100 | #237 | Tragic 83.9% |
| Immigrants | Uzbekistan | 0.8 /100 | #238 | Tragic 83.9% |
| Jamaicans | 0.8 /100 | #239 | Tragic 83.9% |
| Trinidadians and Tobagonians | 0.7 /100 | #240 | Tragic 83.9% |
| Alsatians | 0.7 /100 | #241 | Tragic 83.9% |
| U.S. Virgin Islanders | 0.6 /100 | #242 | Tragic 83.8% |
| Salvadorans | 0.5 /100 | #243 | Tragic 83.8% |
| Immigrants | Jamaica | 0.4 /100 | #244 | Tragic 83.8% |
| Iroquois | 0.4 /100 | #245 | Tragic 83.8% |
| Cree | 0.3 /100 | #246 | Tragic 83.8% |
| Immigrants | El Salvador | 0.3 /100 | #247 | Tragic 83.7% |
Demographics Similar to Pennsylvania Germans by In Labor Force | Age 25-29
In terms of in labor force | age 25-29, the demographic groups most similar to Pennsylvania Germans are Immigrants from Bahamas (83.6%, a difference of 0.0%), Spanish (83.6%, a difference of 0.010%), Immigrants from Guatemala (83.6%, a difference of 0.020%), Delaware (83.7%, a difference of 0.060%), and Immigrants from Fiji (83.6%, a difference of 0.060%).
| Demographics | Rating | Rank | In Labor Force | Age 25-29 |
| Spaniards | 0.2 /100 | #254 | Tragic 83.7% |
| Haitians | 0.2 /100 | #255 | Tragic 83.7% |
| Immigrants | Haiti | 0.2 /100 | #256 | Tragic 83.7% |
| Delaware | 0.2 /100 | #257 | Tragic 83.7% |
| Immigrants | Guatemala | 0.1 /100 | #258 | Tragic 83.6% |
| Spanish | 0.1 /100 | #259 | Tragic 83.6% |
| Immigrants | Bahamas | 0.1 /100 | #260 | Tragic 83.6% |
| Pennsylvania Germans | 0.1 /100 | #261 | Tragic 83.6% |
| Immigrants | Fiji | 0.1 /100 | #262 | Tragic 83.6% |
| West Indians | 0.1 /100 | #263 | Tragic 83.5% |
| Puget Sound Salish | 0.1 /100 | #264 | Tragic 83.5% |
| Cubans | 0.1 /100 | #265 | Tragic 83.5% |
| Aleuts | 0.0 /100 | #266 | Tragic 83.4% |
| Spanish Americans | 0.0 /100 | #267 | Tragic 83.4% |
| Immigrants | Lebanon | 0.0 /100 | #268 | Tragic 83.4% |