Immigrants from Poland vs Slovene In Labor Force | Age 16-19

COMPARE

Immigrants from Poland
Race
Ancestry
AfghanAfricanAlaska NativeAlaskan AthabascanAlbanianAleutAlsatianAmericanApacheArabArapahoArgentineanArmenianAssyrian/Chaldean/SyriacAustralianAustrianBahamianBangladeshiBarbadianBasqueBelgianBelizeanBermudanBhutaneseBlackfeetBolivianBrazilianBritishBritish West IndianBulgarianBurmeseCajunCambodianCanadianCape VerdeanCarpatho RusynCelticCentral AmericanCentral American IndianCherokeeCheyenneChickasawChileanChineseChippewaChoctawColombianColvilleComancheCosta RicanCreeCreekCroatianCrowCubanCypriotCzechCzechoslovakianDanishDelawareDominicanDutchDutch West IndianEastern EuropeanEcuadorianEgyptianEnglishEstonianEthiopianEuropeanFijianFilipinoFinnishFrenchFrench American IndianFrench CanadianGermanGerman RussianGhanaianGreekGuamanian/ChamorroGuatemalanGuyaneseHaitianHmongHonduranHopiHoumaHungarianIcelanderIndian (Asian)IndonesianInupiatIranianIraqiIrishIroquoisIsraeliItalianJamaicanJapaneseJordanianKenyanKiowaKoreanLaotianLatvianLebaneseLiberianLithuanianLumbeeLuxembourgerMacedonianMalaysianMalteseMarshalleseMenomineeMexicanMexican American IndianMongolianMoroccanNative HawaiianNavajoNepaleseNew ZealanderNicaraguanNigerianNorthern EuropeanNorwegianOkinawanOsageOttawaPaiutePakistaniPalestinianPanamanianParaguayanPennsylvania GermanPeruvianPimaPolishPortuguesePotawatomiPuebloPuerto RicanPuget Sound SalishRomanianRussianSalvadoranSamoanScandinavianScotch-IrishScottishSeminoleSenegaleseSerbianShoshoneSierra LeoneanSiouxSlavicSlovakSomaliSouth AfricanSouth AmericanSouth American IndianSoviet UnionSpaniardSpanishSpanish AmericanSpanish American IndianSri LankanSubsaharan AfricanSudaneseSwedishSwissSyrianTaiwaneseThaiTlingit-HaidaTohono O'OdhamTonganTrinidadian and TobagonianTsimshianTurkishU.S. Virgin IslanderUgandanUkrainianUruguayanUteVenezuelanVietnameseWelshWest IndianYakamaYaquiYugoslavianYumanYup'ikZimbabwean
Immigration
NonimmigrantsImmigrantsAfghanistanAfricaAlbaniaArgentinaArmeniaAsiaAustraliaAustriaBahamasBangladeshBarbadosBelarusBelgiumBelizeBoliviaBosnia and HerzegovinaBrazilBulgariaBurma/MyanmarCabo VerdeCambodiaCameroonCanadaCaribbeanCentral AmericaChileChinaColombiaCongoCosta RicaCroatiaCubaCzechoslovakiaDenmarkDominicaDominican RepublicEastern AfricaEastern AsiaEastern EuropeEcuadorEgyptEl SalvadorEnglandEritreaEthiopiaEuropeFijiFranceGermanyGhanaGreeceGrenadaGuatemalaGuyanaHaitiHondurasHong KongHungaryIndiaIndonesiaIranIraqIrelandIsraelItalyJamaicaJapanJordanKazakhstanKenyaKoreaKuwaitLaosLatin AmericaLatviaLebanonLiberiaLithuaniaMalaysiaMexicoMicronesiaMiddle AfricaMoldovaMoroccoNepalNetherlandsNicaraguaNigeriaNorth AmericaNorth MacedoniaNorthern AfricaNorthern EuropeNorwayOceaniaPakistanPanamaPeruPhilippinesPolandPortugalRomaniaRussiaSaudi ArabiaScotlandSenegalSerbiaSierra LeoneSingaporeSomaliaSouth AfricaSouth AmericaSouth Central AsiaSouth Eastern AsiaSouthern EuropeSpainSri LankaSt. Vincent and the GrenadinesSudanSwedenSwitzerlandSyriaTaiwanThailandTrinidad and TobagoTurkeyUgandaUkraineUruguayUzbekistanVenezuelaVietnamWest IndiesWestern AfricaWestern AsiaWestern EuropeYemenZaireZimbabweAzores
Slovene
Race
Ancestry
AfghanAfricanAlaska NativeAlaskan AthabascanAlbanianAleutAlsatianAmericanApacheArabArapahoArgentineanArmenianAssyrian/Chaldean/SyriacAustralianAustrianBahamianBangladeshiBarbadianBasqueBelgianBelizeanBermudanBhutaneseBlackfeetBolivianBrazilianBritishBritish West IndianBulgarianBurmeseCajunCambodianCanadianCape VerdeanCarpatho RusynCelticCentral AmericanCentral American IndianCherokeeCheyenneChickasawChileanChineseChippewaChoctawColombianColvilleComancheCosta RicanCreeCreekCroatianCrowCubanCypriotCzechCzechoslovakianDanishDelawareDominicanDutchDutch West IndianEastern EuropeanEcuadorianEgyptianEnglishEstonianEthiopianEuropeanFijianFilipinoFinnishFrenchFrench American IndianFrench CanadianGermanGerman RussianGhanaianGreekGuamanian/ChamorroGuatemalanGuyaneseHaitianHmongHonduranHopiHoumaHungarianIcelanderIndian (Asian)IndonesianInupiatIranianIraqiIrishIroquoisIsraeliItalianJamaicanJapaneseJordanianKenyanKiowaKoreanLaotianLatvianLebaneseLiberianLithuanianLumbeeLuxembourgerMacedonianMalaysianMalteseMarshalleseMenomineeMexicanMexican American IndianMongolianMoroccanNative HawaiianNavajoNepaleseNew ZealanderNicaraguanNigerianNorthern EuropeanNorwegianOkinawanOsageOttawaPaiutePakistaniPalestinianPanamanianParaguayanPennsylvania GermanPeruvianPimaPolishPortuguesePotawatomiPuebloPuerto RicanPuget Sound SalishRomanianRussianSalvadoranSamoanScandinavianScotch-IrishScottishSeminoleSenegaleseSerbianShoshoneSierra LeoneanSiouxSlavicSlovakSloveneSomaliSouth AfricanSouth AmericanSouth American IndianSoviet UnionSpaniardSpanishSpanish AmericanSpanish American IndianSri LankanSubsaharan AfricanSudaneseSwedishSwissSyrianTaiwaneseThaiTlingit-HaidaTohono O'OdhamTonganTrinidadian and TobagonianTsimshianTurkishU.S. Virgin IslanderUgandanUkrainianUruguayanUteVenezuelanVietnameseWelshWest IndianYakamaYaquiYugoslavianYumanYup'ikZimbabwean
Immigration
NonimmigrantsImmigrantsAfghanistanAfricaAlbaniaArgentinaArmeniaAsiaAustraliaAustriaBahamasBangladeshBarbadosBelarusBelgiumBelizeBoliviaBosnia and HerzegovinaBrazilBulgariaBurma/MyanmarCabo VerdeCambodiaCameroonCanadaCaribbeanCentral AmericaChileChinaColombiaCongoCosta RicaCroatiaCubaCzechoslovakiaDenmarkDominicaDominican RepublicEastern AfricaEastern AsiaEastern EuropeEcuadorEgyptEl SalvadorEnglandEritreaEthiopiaEuropeFijiFranceGermanyGhanaGreeceGrenadaGuatemalaGuyanaHaitiHondurasHong KongHungaryIndiaIndonesiaIranIraqIrelandIsraelItalyJamaicaJapanJordanKazakhstanKenyaKoreaKuwaitLaosLatin AmericaLatviaLebanonLiberiaLithuaniaMalaysiaMexicoMicronesiaMiddle AfricaMoldovaMoroccoNepalNetherlandsNicaraguaNigeriaNorth AmericaNorth MacedoniaNorthern AfricaNorthern EuropeNorwayOceaniaPakistanPanamaPeruPhilippinesPortugalRomaniaRussiaSaudi ArabiaScotlandSenegalSerbiaSierra LeoneSingaporeSomaliaSouth AfricaSouth AmericaSouth Central AsiaSouth Eastern AsiaSouthern EuropeSpainSri LankaSt. Vincent and the GrenadinesSudanSwedenSwitzerlandSyriaTaiwanThailandTrinidad and TobagoTurkeyUgandaUkraineUruguayUzbekistanVenezuelaVietnamWest IndiesWestern AfricaWestern AsiaWestern EuropeYemenZaireZimbabweAzores
In Labor Force | Age 16-19
Income
Poverty
Unemployment
Labor Participation
Family Structure
Vehicle Availability
Education Level
Disability

In Labor Force | Age 16-19 Comparison

Immigrants from Poland

Slovenes

Excellent
Exceptional
37.3%
IN LABOR FORCE | AGE 16-19
84.4/ 100
METRIC RATING
151st/ 347
METRIC RANK
43.7%
IN LABOR FORCE | AGE 16-19
100.0/ 100
METRIC RATING
15th/ 347
METRIC RANK

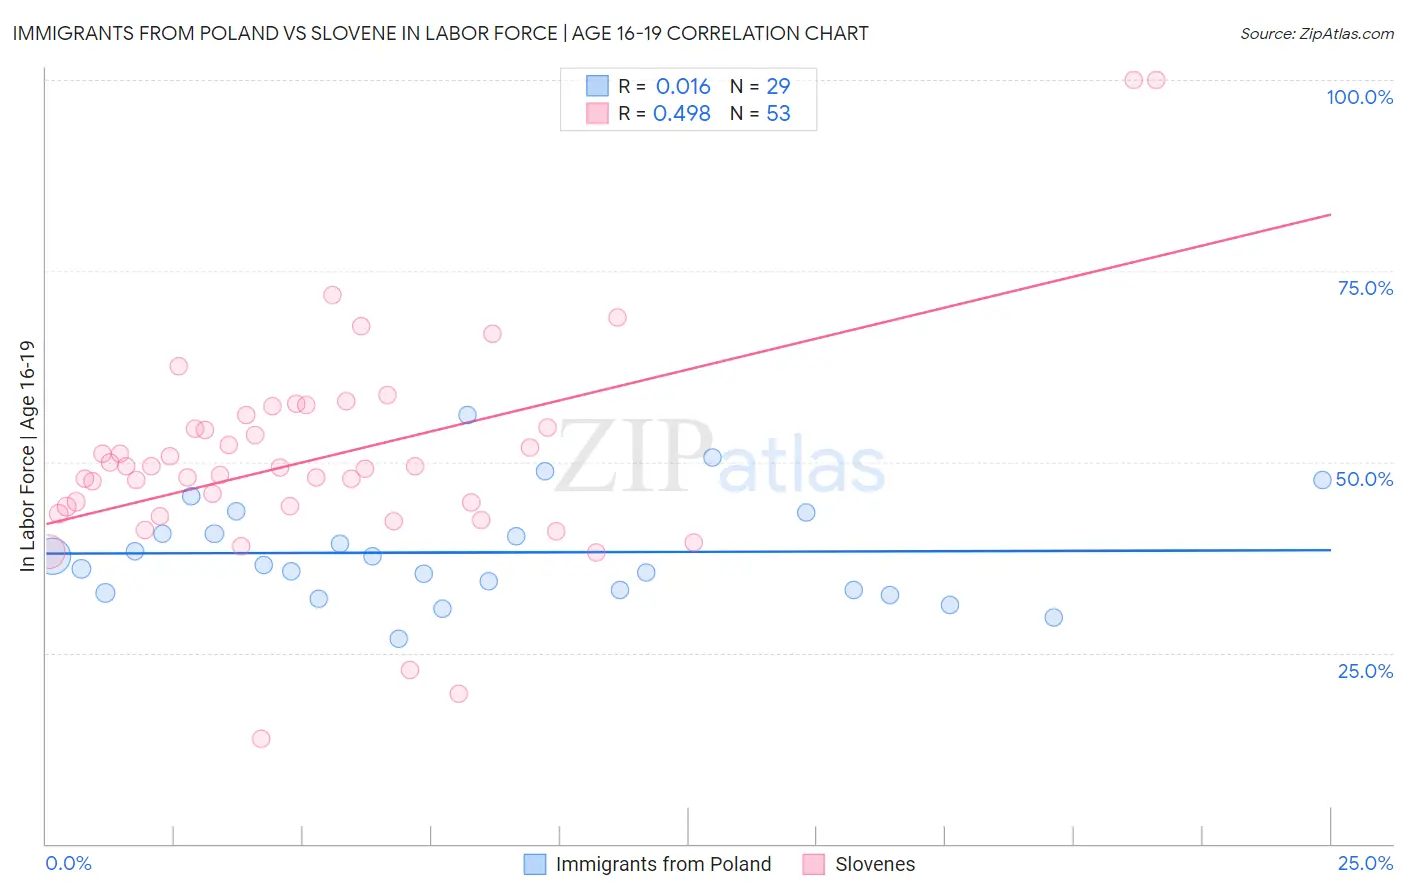
Immigrants from Poland vs Slovene In Labor Force | Age 16-19 Correlation Chart

The statistical analysis conducted on geographies consisting of 304,422,201 people shows no correlation between the proportion of Immigrants from Poland and labor force participation rate among population between the ages 16 and 19 in the United States with a correlation coefficient (R) of 0.016 and weighted average of 37.3%. Similarly, the statistical analysis conducted on geographies consisting of 261,051,776 people shows a moderate positive correlation between the proportion of Slovenes and labor force participation rate among population between the ages 16 and 19 in the United States with a correlation coefficient (R) of 0.498 and weighted average of 43.7%, a difference of 17.0%.
Immigrants from Poland vs Slovene In Labor Force | Age 16-19

In Labor Force | Age 16-19 Correlation Summary

MeasurementImmigrants from PolandSlovene
Minimum26.8%13.8%
Maximum56.2%100.0%
Range29.4%86.2%
Mean38.1%50.5%
Median36.4%49.2%
Interquartile 25% (IQ1)33.1%43.7%
Interquartile 75% (IQ3)42.0%55.3%
Interquartile Range (IQR)9.0%11.6%
Standard Deviation (Sample)6.8%14.6%
Standard Deviation (Population)6.7%14.4%

Similar Demographics by In Labor Force | Age 16-19

Demographics Similar to Immigrants from Poland by In Labor Force | Age 16-19

In terms of in labor force | age 16-19, the demographic groups most similar to Immigrants from Poland are Tsimshian (37.4%, a difference of 0.030%), Native Hawaiian (37.4%, a difference of 0.050%), Immigrants from Sierra Leone (37.3%, a difference of 0.070%), Arapaho (37.3%, a difference of 0.23%), and Immigrants from Bulgaria (37.3%, a difference of 0.25%).
DemographicsRating | RankIn Labor Force | Age 16-19
Japanese
89.3
/100
|
#144
Excellent
37.5%
Paiute
89.3
/100
|
#145
Excellent
37.5%
Immigrants | Western Europe
88.9
/100
|
#146
Excellent
37.5%
Brazilians
88.7
/100
|
#147
Excellent
37.5%
Romanians
87.3
/100
|
#148
Excellent
37.5%
Native Hawaiians
85.0
/100
|
#149
Excellent
37.4%
Tsimshian
84.7
/100
|
#150
Excellent
37.4%
Immigrants | Poland
84.4
/100
|
#151
Excellent
37.3%
Immigrants | Sierra Leone
83.6
/100
|
#152
Excellent
37.3%
Arapaho
81.8
/100
|
#153
Excellent
37.3%
Immigrants | Bulgaria
81.6
/100
|
#154
Excellent
37.3%
Immigrants | Lithuania
80.7
/100
|
#155
Excellent
37.2%
Kiowa
80.4
/100
|
#156
Excellent
37.2%
Immigrants | Brazil
76.5
/100
|
#157
Good
37.1%
Ute
75.7
/100
|
#158
Good
37.1%

Demographics Similar to Slovenes by In Labor Force | Age 16-19

In terms of in labor force | age 16-19, the demographic groups most similar to Slovenes are Czech (43.6%, a difference of 0.11%), Scandinavian (43.6%, a difference of 0.17%), French Canadian (43.6%, a difference of 0.25%), Chippewa (43.8%, a difference of 0.26%), and Dutch (43.8%, a difference of 0.36%).
DemographicsRating | RankIn Labor Force | Age 16-19
Immigrants | Cabo Verde
100.0
/100
|
#8
Exceptional
44.7%
Cape Verdeans
100.0
/100
|
#9
Exceptional
44.5%
Germans
100.0
/100
|
#10
Exceptional
44.2%
Swedes
100.0
/100
|
#11
Exceptional
44.1%
Finns
100.0
/100
|
#12
Exceptional
43.9%
Dutch
100.0
/100
|
#13
Exceptional
43.8%
Chippewa
100.0
/100
|
#14
Exceptional
43.8%
Slovenes
100.0
/100
|
#15
Exceptional
43.7%
Czechs
100.0
/100
|
#16
Exceptional
43.6%
Scandinavians
100.0
/100
|
#17
Exceptional
43.6%
French Canadians
100.0
/100
|
#18
Exceptional
43.6%
Belgians
100.0
/100
|
#19
Exceptional
43.4%
Swiss
100.0
/100
|
#20
Exceptional
43.3%
Ottawa
100.0
/100
|
#21
Exceptional
43.0%
Sudanese
100.0
/100
|
#22
Exceptional
42.9%