Spanish vs Immigrants from Taiwan In Labor Force | Age 25-29
COMPARE
Spanish
Immigrants from Taiwan
In Labor Force | Age 25-29
In Labor Force | Age 25-29 Comparison
Spanish
Immigrants from Taiwan
83.6%
IN LABOR FORCE | AGE 25-29
0.1/ 100
METRIC RATING
259th/ 347
METRIC RANK
84.7%
IN LABOR FORCE | AGE 25-29
62.2/ 100
METRIC RATING
153rd/ 347
METRIC RANK
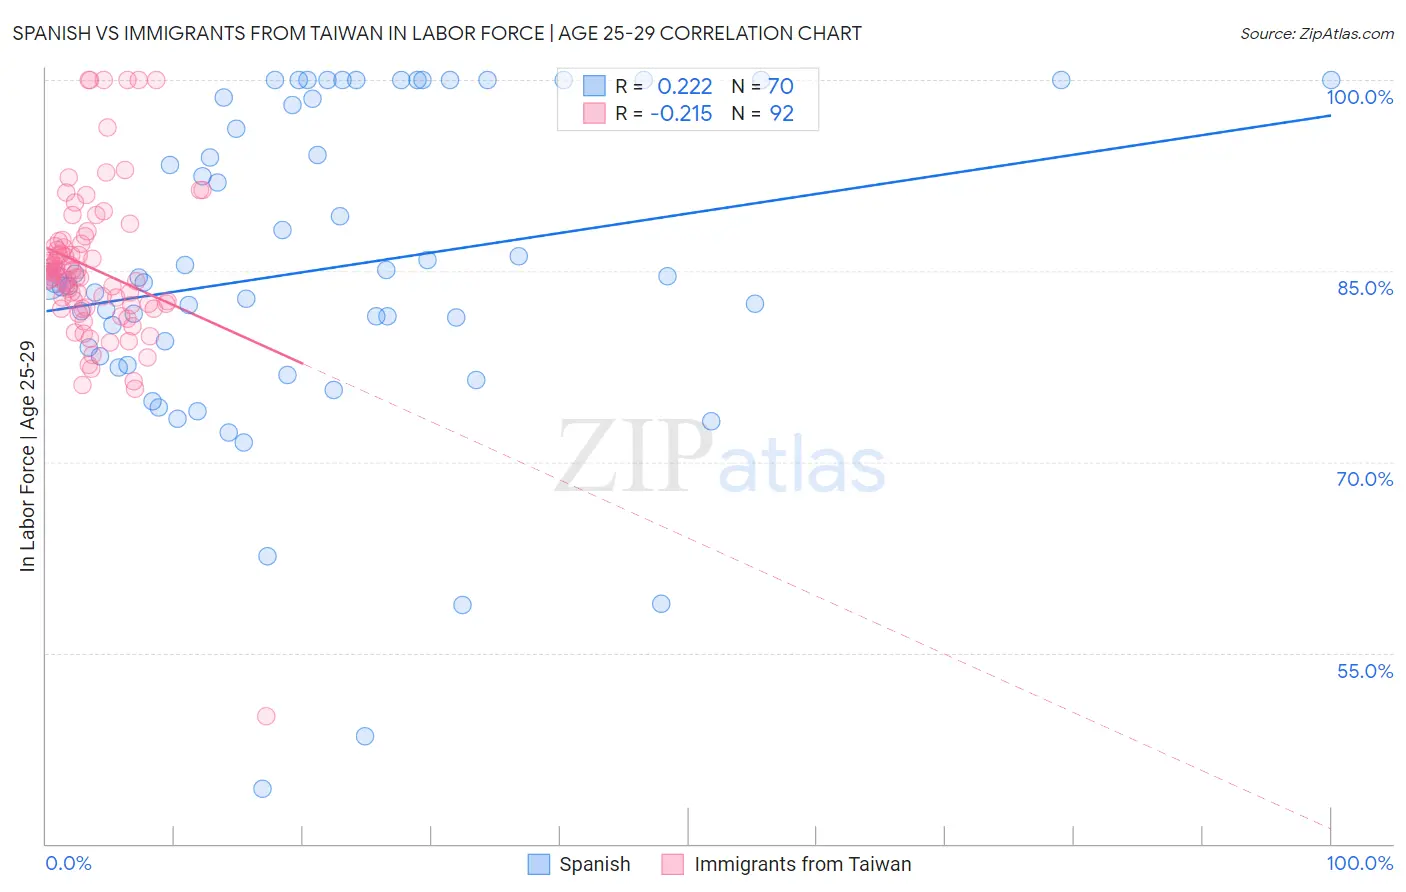
Spanish vs Immigrants from Taiwan In Labor Force | Age 25-29 Correlation Chart
The statistical analysis conducted on geographies consisting of 421,954,329 people shows a weak positive correlation between the proportion of Spanish and labor force participation rate among population between the ages 25 and 29 in the United States with a correlation coefficient (R) of 0.222 and weighted average of 83.6%. Similarly, the statistical analysis conducted on geographies consisting of 298,185,522 people shows a weak negative correlation between the proportion of Immigrants from Taiwan and labor force participation rate among population between the ages 25 and 29 in the United States with a correlation coefficient (R) of -0.215 and weighted average of 84.7%, a difference of 1.3%.
In Labor Force | Age 25-29 Correlation Summary
| Measurement | Spanish | Immigrants from Taiwan |
| Minimum | 44.3% | 50.0% |
| Maximum | 100.0% | 100.0% |
| Range | 55.7% | 50.0% |
| Mean | 85.1% | 85.2% |
| Median | 84.1% | 84.7% |
| Interquartile 25% (IQ1) | 78.3% | 82.3% |
| Interquartile 75% (IQ3) | 98.6% | 87.2% |
| Interquartile Range (IQR) | 20.3% | 5.0% |
| Standard Deviation (Sample) | 12.6% | 6.6% |
| Standard Deviation (Population) | 12.5% | 6.6% |
Similar Demographics by In Labor Force | Age 25-29
Demographics Similar to Spanish by In Labor Force | Age 25-29
In terms of in labor force | age 25-29, the demographic groups most similar to Spanish are Immigrants from Guatemala (83.6%, a difference of 0.010%), Immigrants from Bahamas (83.6%, a difference of 0.010%), Pennsylvania German (83.6%, a difference of 0.010%), Immigrants from Haiti (83.7%, a difference of 0.050%), and Delaware (83.7%, a difference of 0.050%).
| Demographics | Rating | Rank | In Labor Force | Age 25-29 |
| Guatemalans | 0.2 /100 | #252 | Tragic 83.7% |
| Immigrants | Trinidad and Tobago | 0.2 /100 | #253 | Tragic 83.7% |
| Spaniards | 0.2 /100 | #254 | Tragic 83.7% |
| Haitians | 0.2 /100 | #255 | Tragic 83.7% |
| Immigrants | Haiti | 0.2 /100 | #256 | Tragic 83.7% |
| Delaware | 0.2 /100 | #257 | Tragic 83.7% |
| Immigrants | Guatemala | 0.1 /100 | #258 | Tragic 83.6% |
| Spanish | 0.1 /100 | #259 | Tragic 83.6% |
| Immigrants | Bahamas | 0.1 /100 | #260 | Tragic 83.6% |
| Pennsylvania Germans | 0.1 /100 | #261 | Tragic 83.6% |
| Immigrants | Fiji | 0.1 /100 | #262 | Tragic 83.6% |
| West Indians | 0.1 /100 | #263 | Tragic 83.5% |
| Puget Sound Salish | 0.1 /100 | #264 | Tragic 83.5% |
| Cubans | 0.1 /100 | #265 | Tragic 83.5% |
| Aleuts | 0.0 /100 | #266 | Tragic 83.4% |
Demographics Similar to Immigrants from Taiwan by In Labor Force | Age 25-29
In terms of in labor force | age 25-29, the demographic groups most similar to Immigrants from Taiwan are Colombian (84.7%, a difference of 0.0%), Immigrants from Pakistan (84.7%, a difference of 0.0%), Immigrants from Sri Lanka (84.7%, a difference of 0.0%), Indian (Asian) (84.7%, a difference of 0.010%), and French (84.7%, a difference of 0.010%).
| Demographics | Rating | Rank | In Labor Force | Age 25-29 |
| Icelanders | 68.2 /100 | #146 | Good 84.8% |
| Immigrants | Asia | 68.2 /100 | #147 | Good 84.8% |
| Immigrants | England | 65.2 /100 | #148 | Good 84.7% |
| Peruvians | 64.7 /100 | #149 | Good 84.7% |
| Swiss | 64.7 /100 | #150 | Good 84.7% |
| Colombians | 62.8 /100 | #151 | Good 84.7% |
| Immigrants | Pakistan | 62.7 /100 | #152 | Good 84.7% |
| Immigrants | Taiwan | 62.2 /100 | #153 | Good 84.7% |
| Immigrants | Sri Lanka | 61.7 /100 | #154 | Good 84.7% |
| Indians (Asian) | 61.6 /100 | #155 | Good 84.7% |
| French | 61.0 /100 | #156 | Good 84.7% |
| British | 60.4 /100 | #157 | Good 84.7% |
| Immigrants | Ghana | 60.2 /100 | #158 | Good 84.7% |
| Immigrants | Western Africa | 60.1 /100 | #159 | Good 84.7% |
| Immigrants | Peru | 58.6 /100 | #160 | Average 84.7% |