Soviet Union vs Native Hawaiian In Labor Force | Age 16-19
COMPARE
Soviet Union
Native Hawaiian
In Labor Force | Age 16-19
In Labor Force | Age 16-19 Comparison
Soviet Union
Native Hawaiians
31.4%
IN LABOR FORCE | AGE 16-19
0.0/ 100
METRIC RATING
319th/ 347
METRIC RANK
37.4%
IN LABOR FORCE | AGE 16-19
85.0/ 100
METRIC RATING
149th/ 347
METRIC RANK
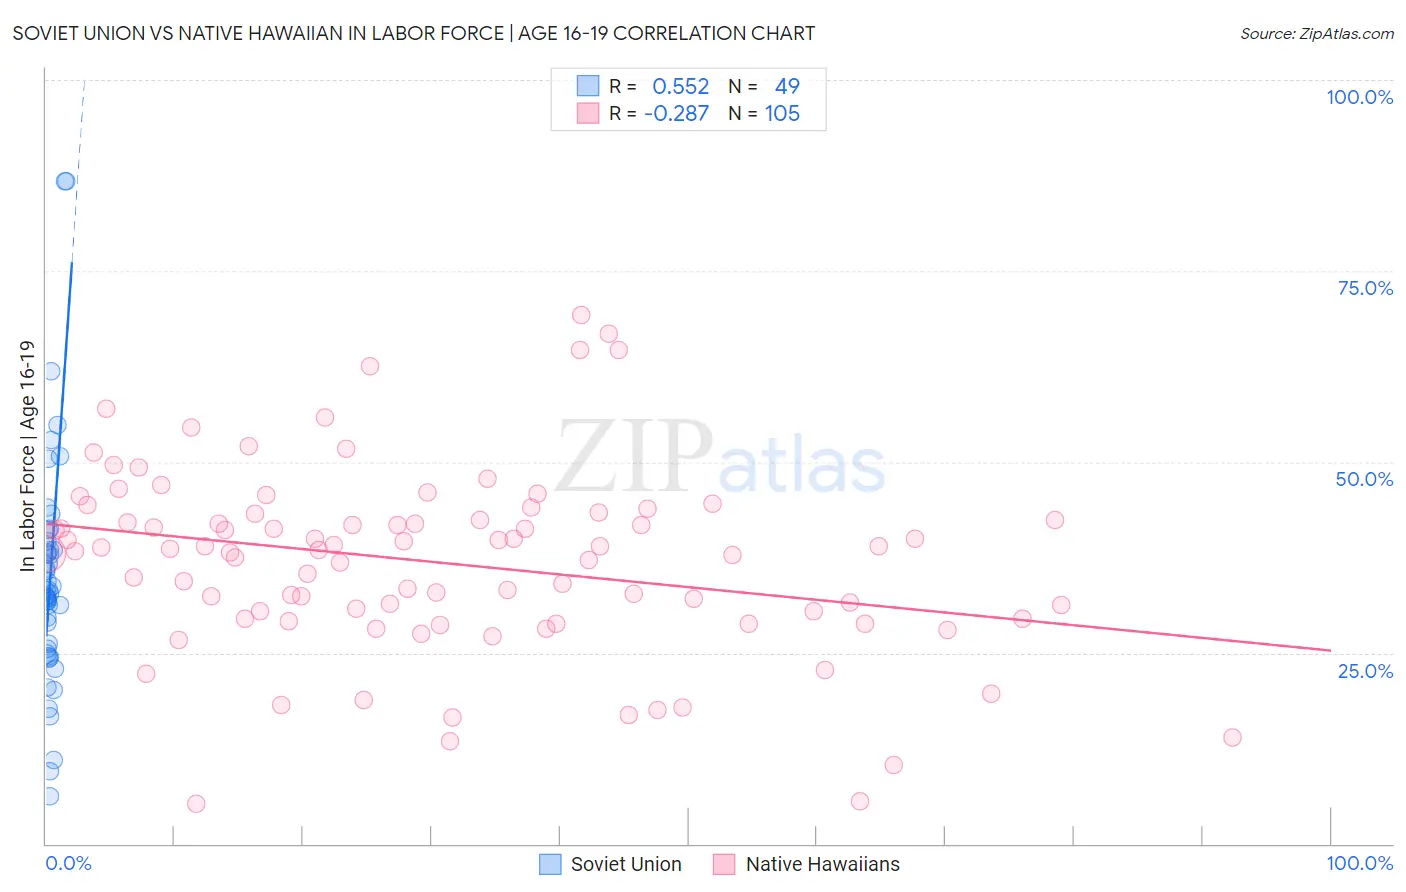
Soviet Union vs Native Hawaiian In Labor Force | Age 16-19 Correlation Chart
The statistical analysis conducted on geographies consisting of 43,506,709 people shows a substantial positive correlation between the proportion of Soviet Union and labor force participation rate among population between the ages 16 and 19 in the United States with a correlation coefficient (R) of 0.552 and weighted average of 31.4%. Similarly, the statistical analysis conducted on geographies consisting of 331,673,637 people shows a weak negative correlation between the proportion of Native Hawaiians and labor force participation rate among population between the ages 16 and 19 in the United States with a correlation coefficient (R) of -0.287 and weighted average of 37.4%, a difference of 19.0%.
In Labor Force | Age 16-19 Correlation Summary
| Measurement | Soviet Union | Native Hawaiian |
| Minimum | 6.3% | 5.3% |
| Maximum | 86.7% | 69.2% |
| Range | 80.4% | 63.9% |
| Mean | 34.8% | 36.8% |
| Median | 32.7% | 38.4% |
| Interquartile 25% (IQ1) | 25.2% | 29.4% |
| Interquartile 75% (IQ3) | 39.1% | 42.8% |
| Interquartile Range (IQR) | 13.9% | 13.3% |
| Standard Deviation (Sample) | 15.5% | 12.2% |
| Standard Deviation (Population) | 15.4% | 12.2% |
Similar Demographics by In Labor Force | Age 16-19
Demographics Similar to Soviet Union by In Labor Force | Age 16-19
In terms of in labor force | age 16-19, the demographic groups most similar to Soviet Union are Ecuadorian (31.4%, a difference of 0.060%), West Indian (31.3%, a difference of 0.30%), Immigrants from Yemen (31.5%, a difference of 0.32%), Tohono O'odham (31.3%, a difference of 0.41%), and Immigrants from Caribbean (31.2%, a difference of 0.54%).
| Demographics | Rating | Rank | In Labor Force | Age 16-19 |
| Immigrants | Belize | 0.0 /100 | #312 | Tragic 31.8% |
| Hopi | 0.0 /100 | #313 | Tragic 31.8% |
| Cubans | 0.0 /100 | #314 | Tragic 31.8% |
| Immigrants | West Indies | 0.0 /100 | #315 | Tragic 31.7% |
| Filipinos | 0.0 /100 | #316 | Tragic 31.7% |
| Immigrants | Nicaragua | 0.0 /100 | #317 | Tragic 31.6% |
| Immigrants | Yemen | 0.0 /100 | #318 | Tragic 31.5% |
| Soviet Union | 0.0 /100 | #319 | Tragic 31.4% |
| Ecuadorians | 0.0 /100 | #320 | Tragic 31.4% |
| West Indians | 0.0 /100 | #321 | Tragic 31.3% |
| Tohono O'odham | 0.0 /100 | #322 | Tragic 31.3% |
| Immigrants | Caribbean | 0.0 /100 | #323 | Tragic 31.2% |
| Dominicans | 0.0 /100 | #324 | Tragic 31.2% |
| Immigrants | China | 0.0 /100 | #325 | Tragic 31.1% |
| Immigrants | Dominican Republic | 0.0 /100 | #326 | Tragic 31.1% |
Demographics Similar to Native Hawaiians by In Labor Force | Age 16-19
In terms of in labor force | age 16-19, the demographic groups most similar to Native Hawaiians are Tsimshian (37.4%, a difference of 0.030%), Immigrants from Poland (37.3%, a difference of 0.050%), Immigrants from Sierra Leone (37.3%, a difference of 0.13%), Romanian (37.5%, a difference of 0.24%), and Arapaho (37.3%, a difference of 0.28%).
| Demographics | Rating | Rank | In Labor Force | Age 16-19 |
| Sierra Leoneans | 89.7 /100 | #142 | Excellent 37.6% |
| Pakistanis | 89.5 /100 | #143 | Excellent 37.6% |
| Japanese | 89.3 /100 | #144 | Excellent 37.5% |
| Paiute | 89.3 /100 | #145 | Excellent 37.5% |
| Immigrants | Western Europe | 88.9 /100 | #146 | Excellent 37.5% |
| Brazilians | 88.7 /100 | #147 | Excellent 37.5% |
| Romanians | 87.3 /100 | #148 | Excellent 37.5% |
| Native Hawaiians | 85.0 /100 | #149 | Excellent 37.4% |
| Tsimshian | 84.7 /100 | #150 | Excellent 37.4% |
| Immigrants | Poland | 84.4 /100 | #151 | Excellent 37.3% |
| Immigrants | Sierra Leone | 83.6 /100 | #152 | Excellent 37.3% |
| Arapaho | 81.8 /100 | #153 | Excellent 37.3% |
| Immigrants | Bulgaria | 81.6 /100 | #154 | Excellent 37.3% |
| Immigrants | Lithuania | 80.7 /100 | #155 | Excellent 37.2% |
| Kiowa | 80.4 /100 | #156 | Excellent 37.2% |