South American Indian vs South African In Labor Force | Age 45-54
COMPARE
South American Indian
South African
In Labor Force | Age 45-54
In Labor Force | Age 45-54 Comparison
South American Indians
South Africans
82.9%
IN LABOR FORCE | AGE 45-54
62.2/ 100
METRIC RATING
161st/ 347
METRIC RANK
82.6%
IN LABOR FORCE | AGE 45-54
28.0/ 100
METRIC RATING
188th/ 347
METRIC RANK
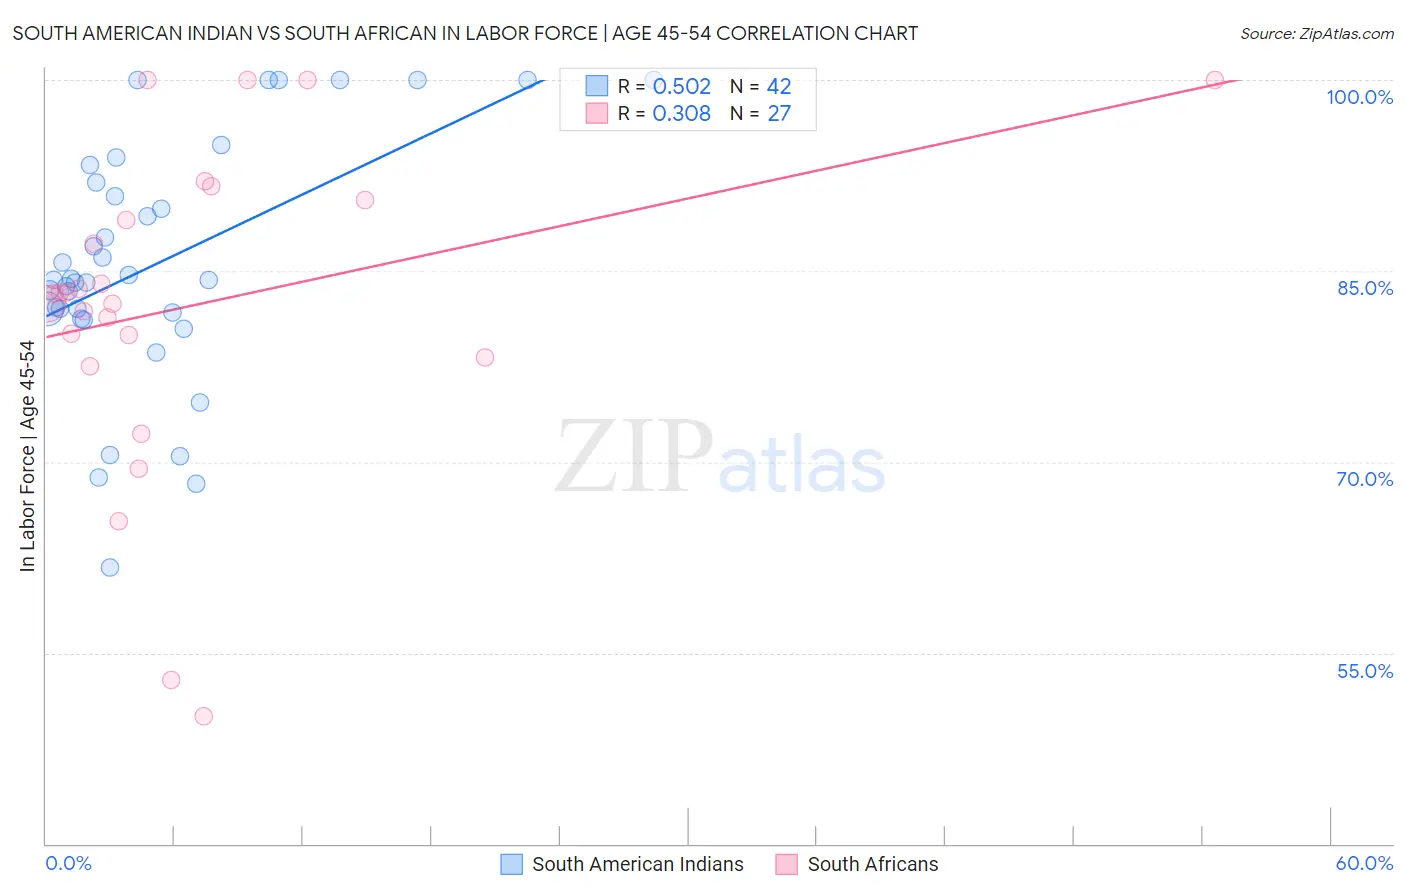
South American Indian vs South African In Labor Force | Age 45-54 Correlation Chart
The statistical analysis conducted on geographies consisting of 164,535,706 people shows a substantial positive correlation between the proportion of South American Indians and labor force participation rate among population between the ages 45 and 54 in the United States with a correlation coefficient (R) of 0.502 and weighted average of 82.9%. Similarly, the statistical analysis conducted on geographies consisting of 182,539,352 people shows a mild positive correlation between the proportion of South Africans and labor force participation rate among population between the ages 45 and 54 in the United States with a correlation coefficient (R) of 0.308 and weighted average of 82.6%, a difference of 0.32%.
In Labor Force | Age 45-54 Correlation Summary
| Measurement | South American Indian | South African |
| Minimum | 61.7% | 50.0% |
| Maximum | 100.0% | 100.0% |
| Range | 38.3% | 50.0% |
| Mean | 85.5% | 82.3% |
| Median | 84.3% | 83.2% |
| Interquartile 25% (IQ1) | 81.7% | 78.2% |
| Interquartile 75% (IQ3) | 91.9% | 90.6% |
| Interquartile Range (IQR) | 10.2% | 12.4% |
| Standard Deviation (Sample) | 9.5% | 12.5% |
| Standard Deviation (Population) | 9.4% | 12.3% |
Similar Demographics by In Labor Force | Age 45-54
Demographics Similar to South American Indians by In Labor Force | Age 45-54
In terms of in labor force | age 45-54, the demographic groups most similar to South American Indians are Haitian (82.8%, a difference of 0.0%), Dutch (82.8%, a difference of 0.0%), Laotian (82.9%, a difference of 0.010%), German Russian (82.8%, a difference of 0.010%), and Immigrants from Austria (82.9%, a difference of 0.020%).
| Demographics | Rating | Rank | In Labor Force | Age 45-54 |
| Immigrants | Ghana | 70.3 /100 | #154 | Good 82.9% |
| Immigrants | Philippines | 69.0 /100 | #155 | Good 82.9% |
| Immigrants | Saudi Arabia | 68.8 /100 | #156 | Good 82.9% |
| Immigrants | Australia | 68.2 /100 | #157 | Good 82.9% |
| Immigrants | Southern Europe | 67.8 /100 | #158 | Good 82.9% |
| Immigrants | Austria | 64.6 /100 | #159 | Good 82.9% |
| Laotians | 62.8 /100 | #160 | Good 82.9% |
| South American Indians | 62.2 /100 | #161 | Good 82.9% |
| Haitians | 61.8 /100 | #162 | Good 82.8% |
| Dutch | 61.7 /100 | #163 | Good 82.8% |
| German Russians | 61.3 /100 | #164 | Good 82.8% |
| Immigrants | Sudan | 59.9 /100 | #165 | Average 82.8% |
| Immigrants | South Eastern Asia | 57.4 /100 | #166 | Average 82.8% |
| Swiss | 56.5 /100 | #167 | Average 82.8% |
| Immigrants | South Africa | 55.8 /100 | #168 | Average 82.8% |
Demographics Similar to South Africans by In Labor Force | Age 45-54
In terms of in labor force | age 45-54, the demographic groups most similar to South Africans are Immigrants from Costa Rica (82.6%, a difference of 0.0%), Irish (82.6%, a difference of 0.010%), Syrian (82.6%, a difference of 0.020%), British (82.6%, a difference of 0.030%), and Immigrants from England (82.6%, a difference of 0.040%).
| Demographics | Rating | Rank | In Labor Force | Age 45-54 |
| Israelis | 37.7 /100 | #181 | Fair 82.7% |
| Immigrants | Hungary | 37.1 /100 | #182 | Fair 82.7% |
| New Zealanders | 32.7 /100 | #183 | Fair 82.6% |
| Europeans | 32.6 /100 | #184 | Fair 82.6% |
| Immigrants | England | 32.2 /100 | #185 | Fair 82.6% |
| Irish | 29.2 /100 | #186 | Fair 82.6% |
| Immigrants | Costa Rica | 28.3 /100 | #187 | Fair 82.6% |
| South Africans | 28.0 /100 | #188 | Fair 82.6% |
| Syrians | 26.0 /100 | #189 | Fair 82.6% |
| British | 25.7 /100 | #190 | Fair 82.6% |
| Armenians | 23.2 /100 | #191 | Fair 82.5% |
| Immigrants | Iraq | 20.9 /100 | #192 | Fair 82.5% |
| Australians | 20.8 /100 | #193 | Fair 82.5% |
| Immigrants | Norway | 20.7 /100 | #194 | Fair 82.5% |
| Immigrants | Canada | 20.0 /100 | #195 | Fair 82.5% |